Meta Platforms Inc. Elliott Wave technical analysis [Video]
![Meta Platforms Inc. Elliott Wave technical analysis [Video]](https://editorial.fxstreet.com/images/Markets/Equities/curved-stock-exchange-ticker-numbers-and-arrows-on-black-58549200_XtraLarge.jpg)
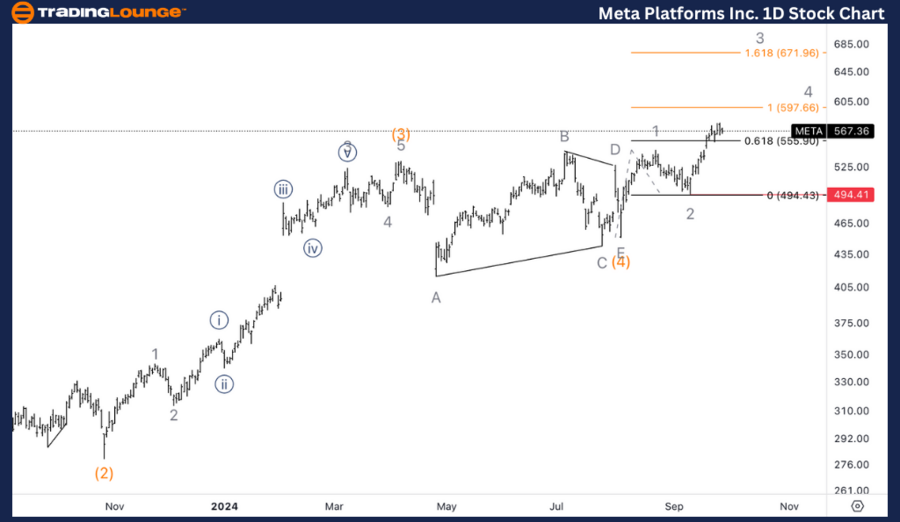
META Elliott Wave Analysis Trading Lounge Daily Chart,
Meta Platforms Inc., (META) Daily Chart
META Elliott Wave technical analysis
Function: Trend.
Mode: Impulsive.
Structure: Motive.
Position: Intermediate wave (5).
Direction: Upside within wave (5).
Details: We are taking off fro TradingLevel5 at 500$ and we are now looking for upside within MediumLevel at 650$ as the next target.
META Elliott Wave technical analysis – Daily chart
On the daily chart, Meta Platforms is in an impulsive structure, advancing within Intermediate Wave (5). After bouncing off TradingLevel5 at $500,
the stock is now trending higher with $650 as the next major upside target, which aligns with a Medium Level resistance.
This upward trajectory within Wave (5) suggests that the bullish trend is firmly intact, and the stock is likely to experience further gains as it approaches the $650 target. Traders should look for key resistance levels near $650 to assess the potential for a corrective wave following this strong upward move.
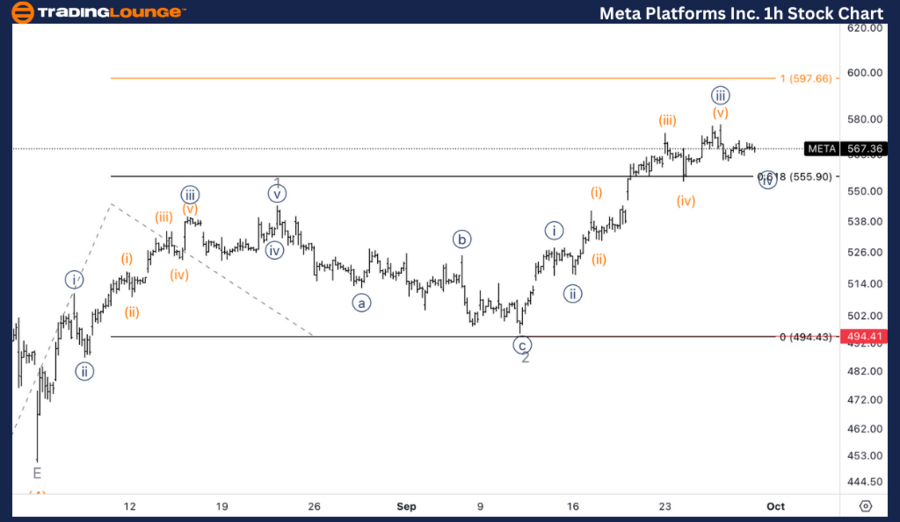
Meta Platforms Inc.,(META) 1H Chart
META Elliott Wave technical analysis
Function: Trend.
Mode: Impulsive.
Structure: Motive.
Position: Minor 3 of (5).
Direction: Upside within wave 3.
Details: Looking for a subdivision within wave 3 as we seem to be continuing higher in wave {v} of 3.
This Elliott Wave analysis for Meta Platforms Inc. (META) examines both the daily and 1-hour charts, offering insights into the stock's current price structure and potential future moves.
META Elliott Wave technical analysis – One-hour chart
On the 1-hour chart, Meta Platforms is advancing within Minor Wave 3 of (5). The current structure shows ongoing upside momentum, with further subdivision occurring within Wave {v} of 3. This suggests that the stock is in the later stages of Wave 3, but there is still room for additional upside as Wave {v} unfolds.
As the price progresses, traders should watch for signs of exhaustion in Wave 3, which could indicate a pullback or correction before the next wave sequence begins.
Meta Platforms Inc. Elliott Wave technical analysis [Video]
Author

Peter Mathers
TradingLounge
Peter Mathers started actively trading in 1982. He began his career at Hoei and Shoin, a Japanese futures trading company.


