Meta: More comprehensive

S2N spotlight
Today we will focus on META for a more comprehensive look. If you haven't worked out by now, I am a very punny guy. I love dropping them. META has been up an incredible 20 consecutive days, the most for any of the magnificent 7 companies.
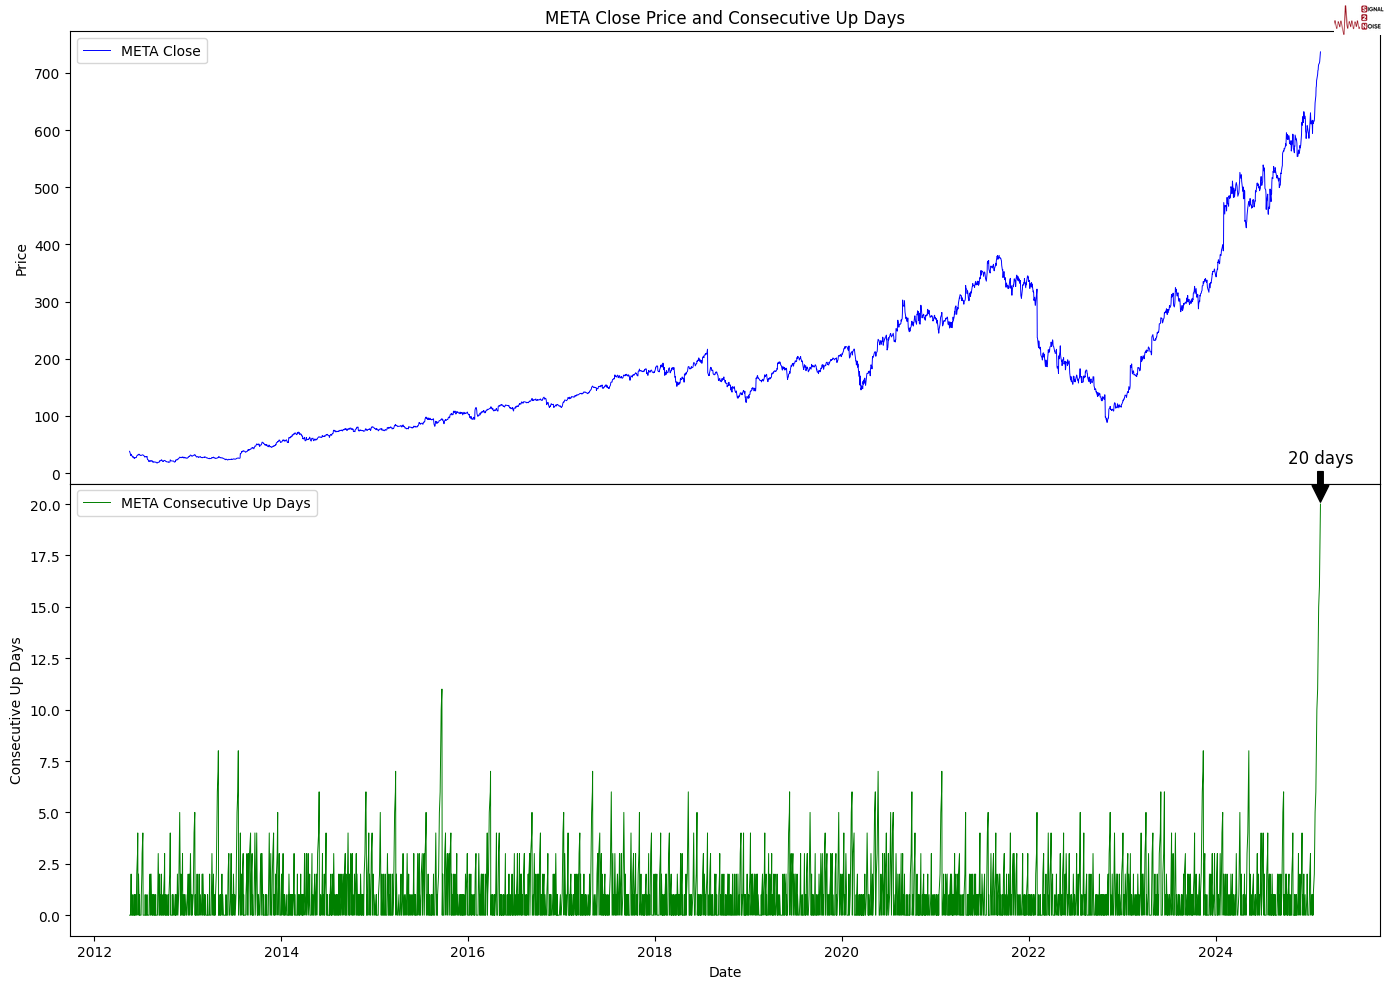
I guess before we continue the spotlight, I might as well unpack how rare this is. If we were talking a normal distribution in the truest sense of the word, i.e., with an average of 50% up and down, then getting 20 up in a row would be a one in a million probability.
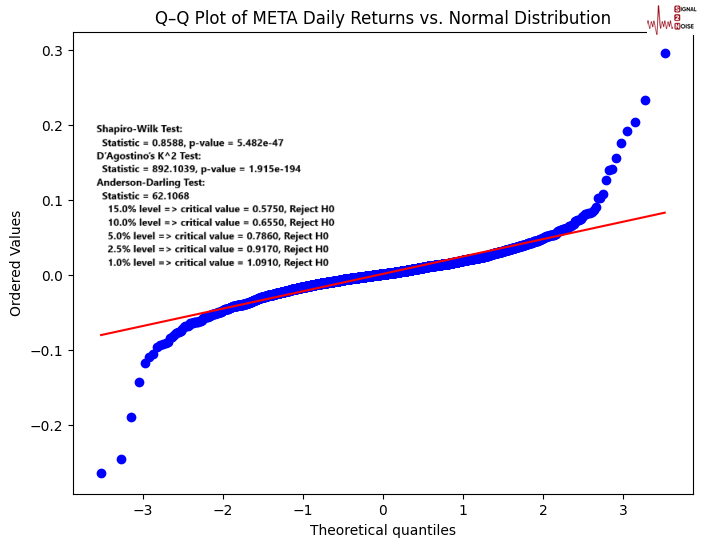
However, anyone who has worked with financial time series will know that they are not so normal. Stocks have memory, at least more than my grandmother towards the end. Let's get the Geeky stuff out of the way. I have added the results of 3 normality tests to the chart. META is not normal; then again, who is these days? I would likely fail all 3 tests myself.
The bottom line is META has up days on average 52.5% of the time. The probability of getting 20 consecutive up days with our non-normal distribution is 1 in 389,000. That was a wordy way of saying this is rare.
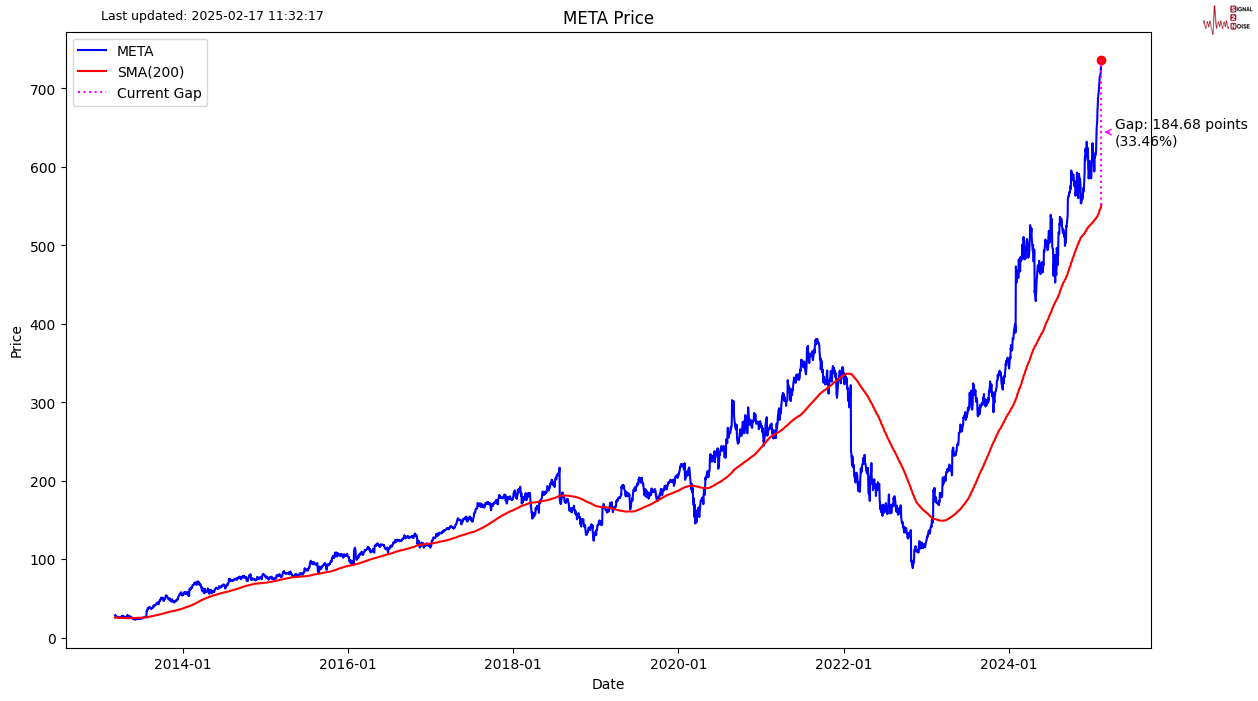
Take a look at the distance of the current price from its 200-day moving average. 33% is bigger than anything we have seen in the past. A gap like that could easily swallow an X. Shots fired Elon.
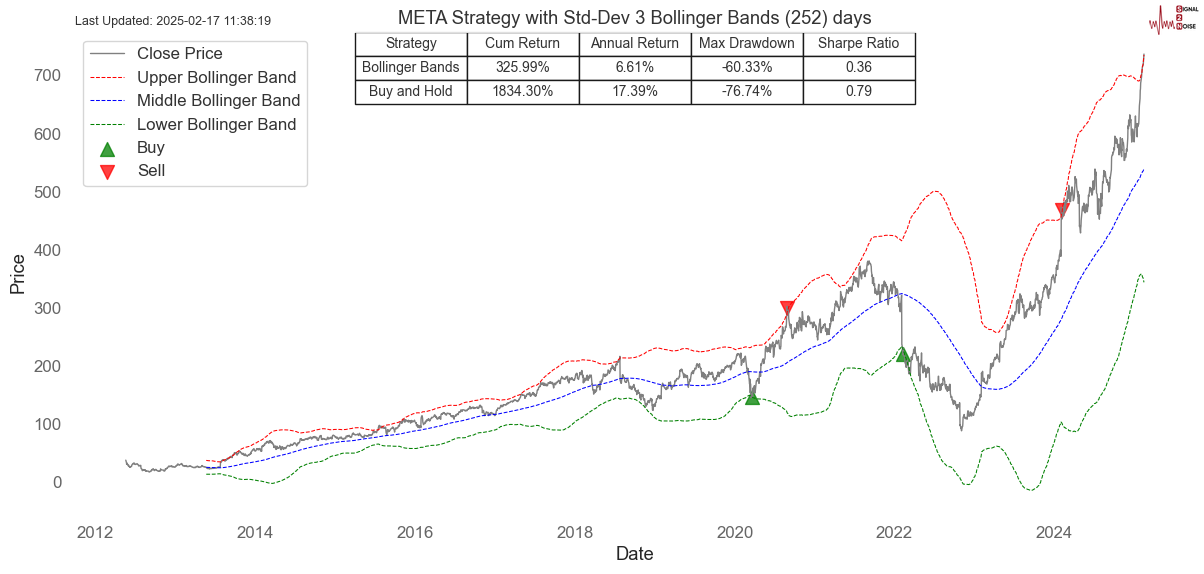
Let us take another look at how far META's share price has moved. It is about to hit the 3 standard deviation upper Bollinger band. This has only happened twice in the past. I share a strategy below that trades such extremes. You would be better off never trading this strategy if you want to make money and avoid dying of boredom waiting for a signal that turns out not to be as good as you would think.
Let us go a bit deeper. This strategy looks for a more short-term overbought strategy with a 100-day RSI above 95. This has only happened 3 times. We got the 3rd signal last week. If you sell now and hold for a month, you would lose money.
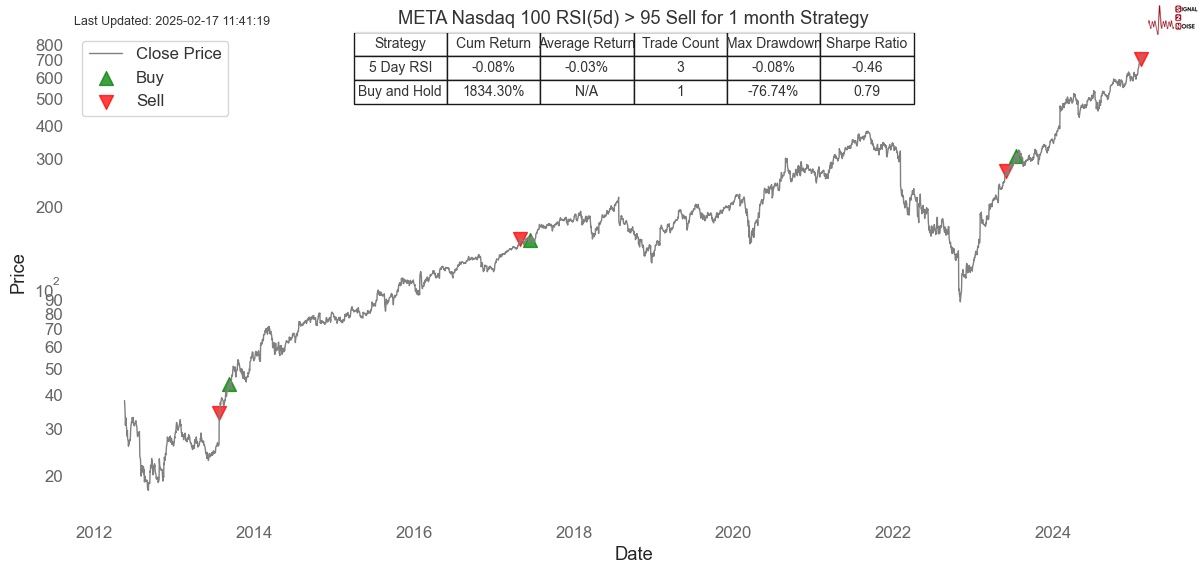
With all that I have said, I have shown we are in a very rare overbought situation. I would certainly look to short META for a few days with this current overbought setup. The probability of more consecutive up days is getting exponentially more unlikely, favouring a short. The trader in me is keen; this is not financial advice.
S2N observations
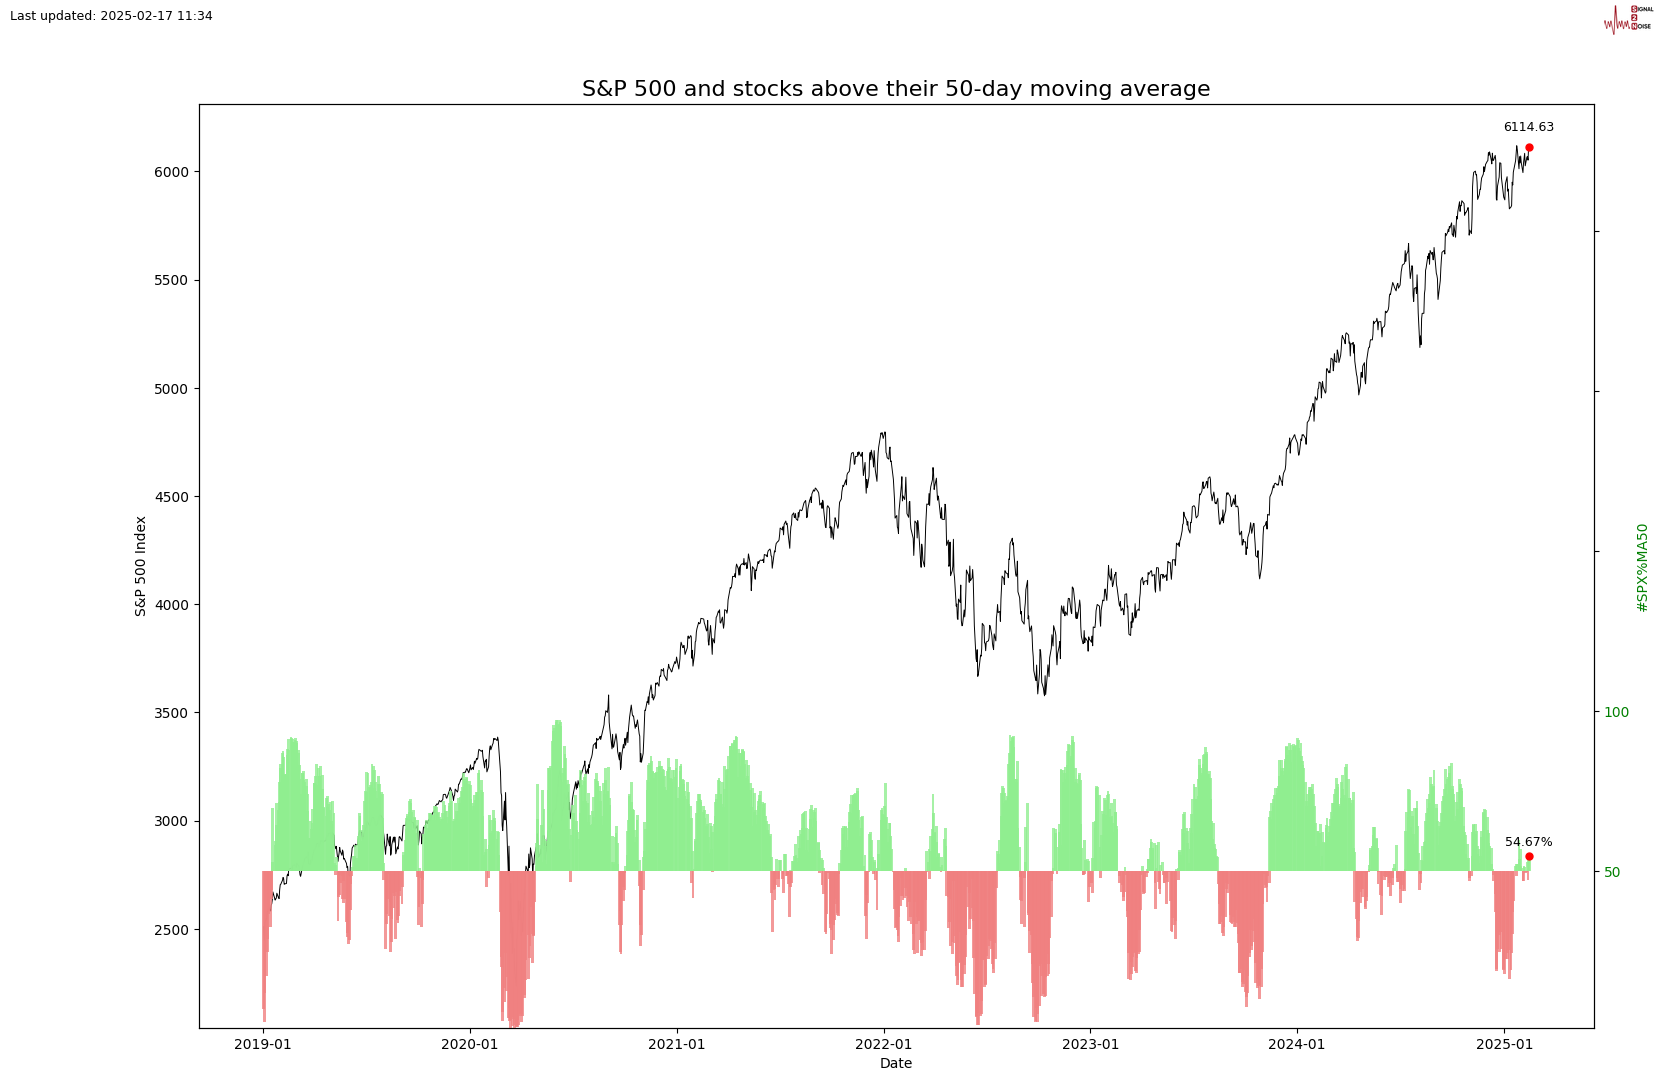
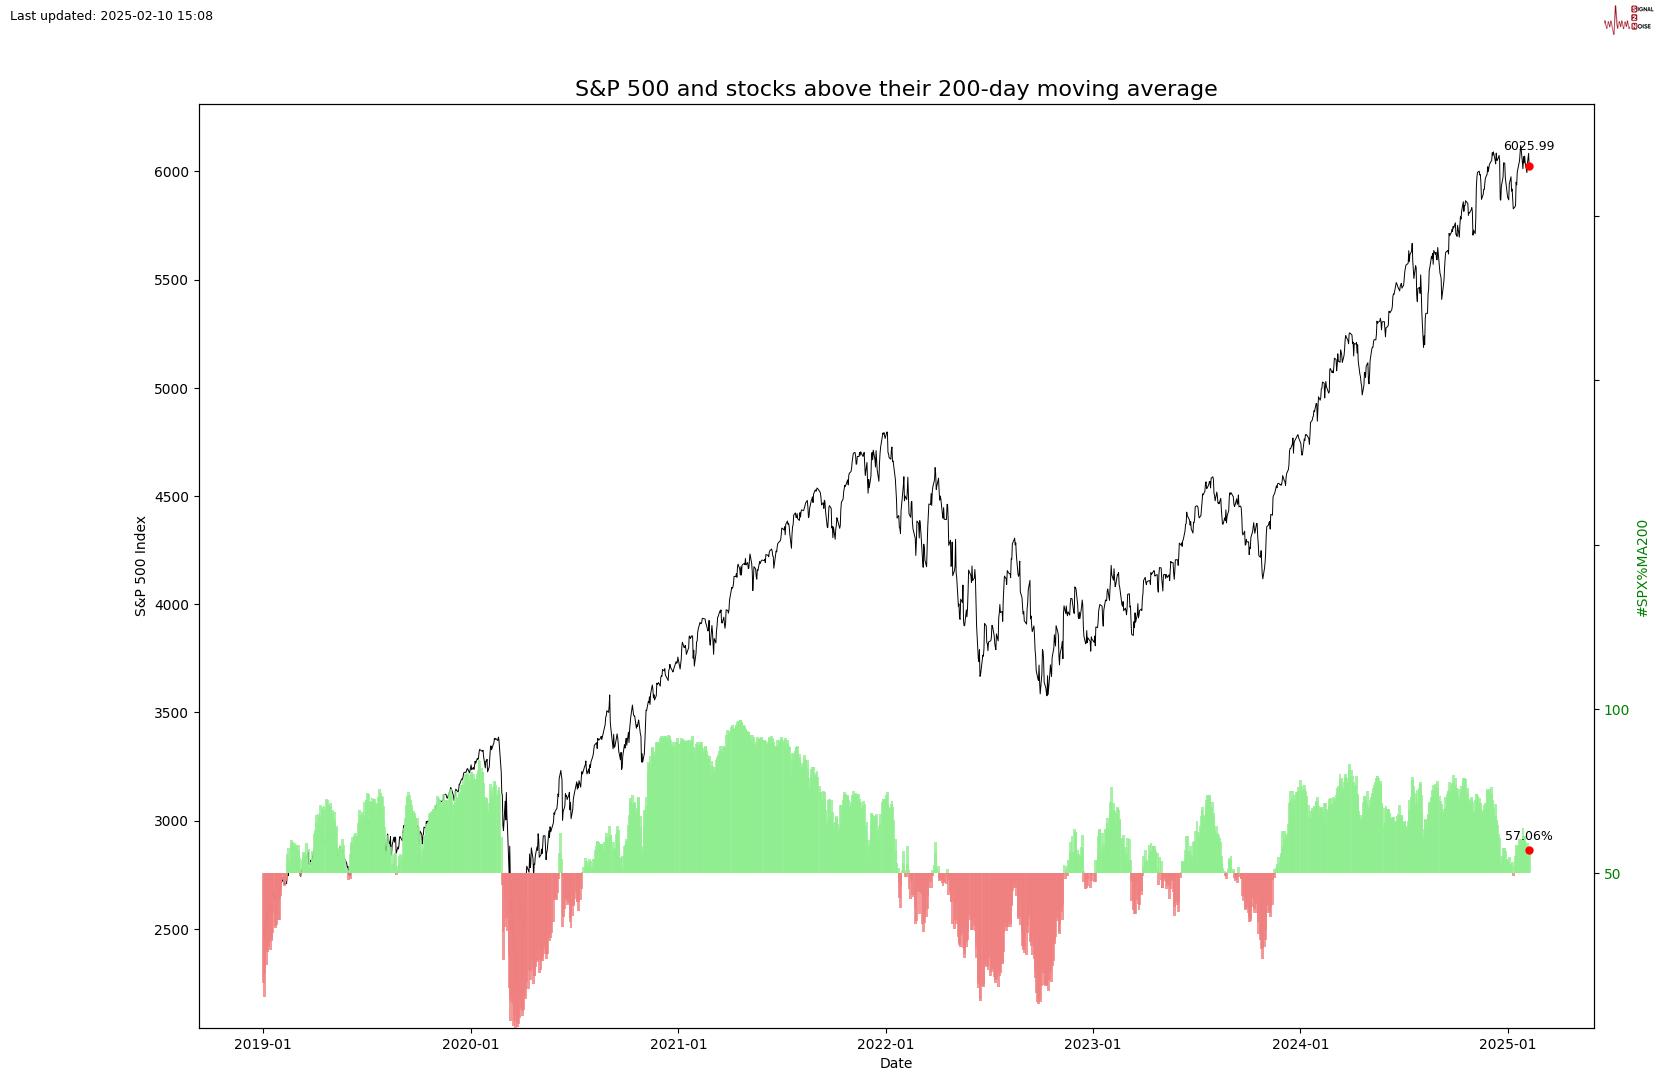
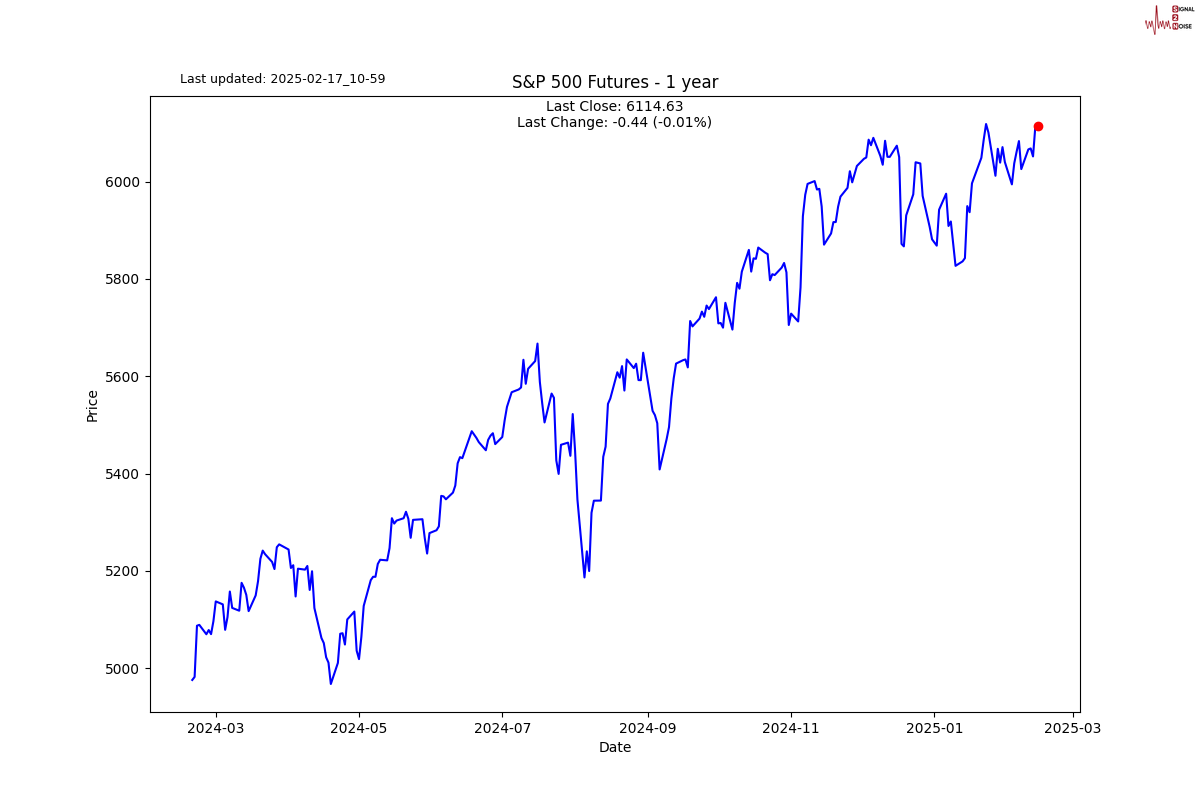
I have said on a number of occasions that I think the S&P 500 will end the year below where it started the year. We are close to another all-time high. As you can see below, the market breadth is still positive, with more than 50% of companies in the S&P 500 above their 50-day and 200-day moving averages. We are likely to see some more upside during the week. The US markets are closed today.
S2N screener alerts
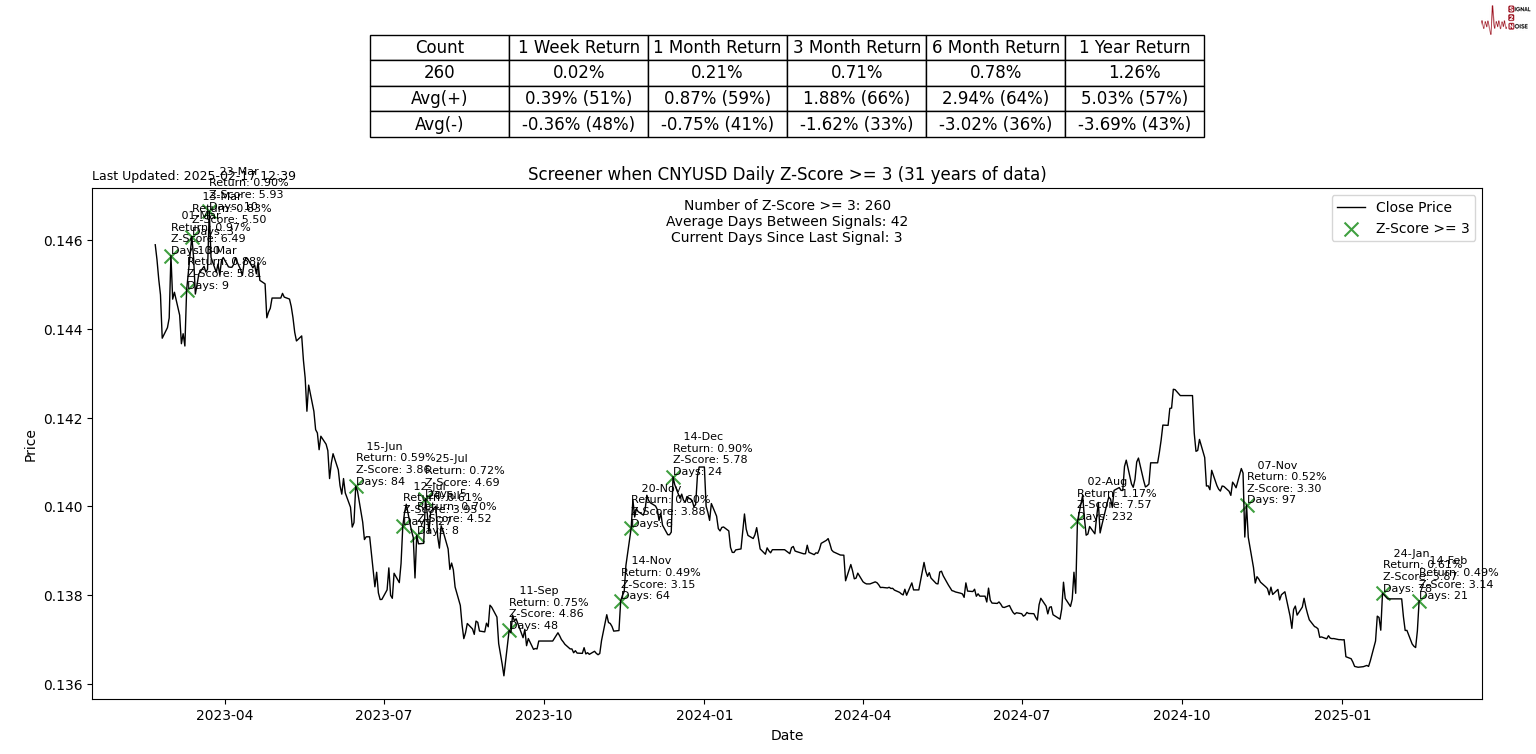
The Chinese Renminbi has a rare 3-sigma up day on Friday. The return may have only been 0.49%, but the Z-Score tells us this is rare given its history of 31 years. Tarriff wars are fast becoming currency wars.
Performance review
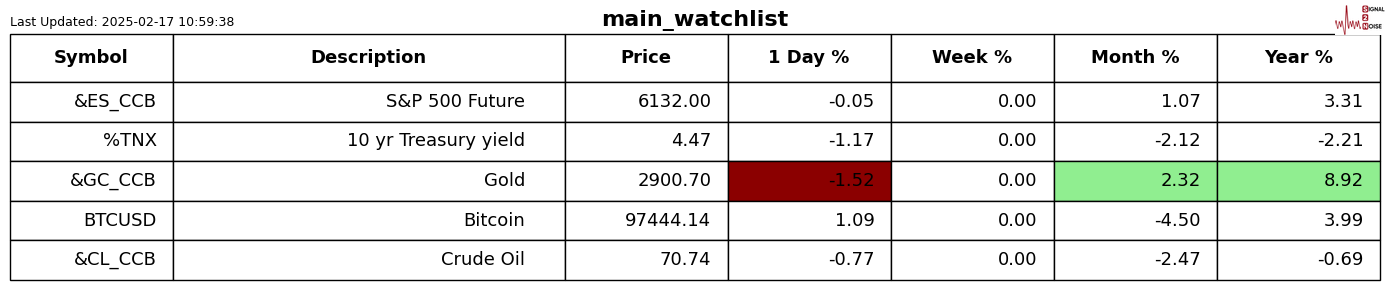
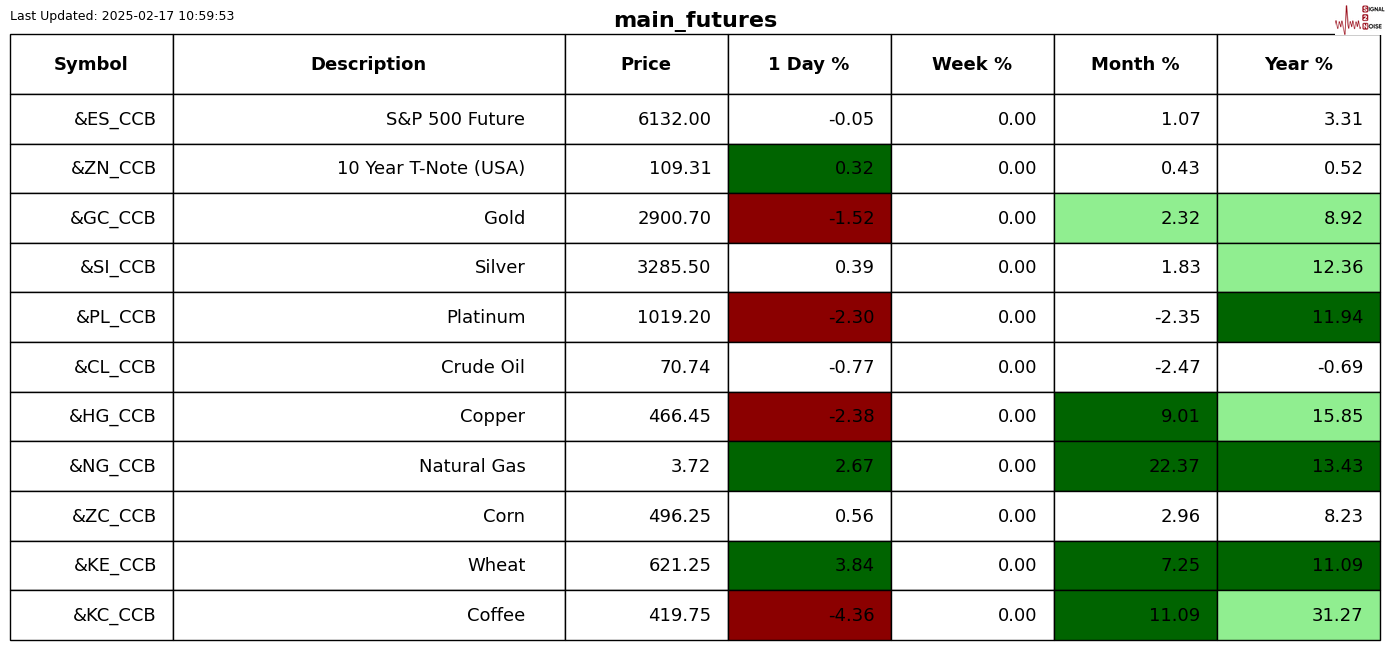
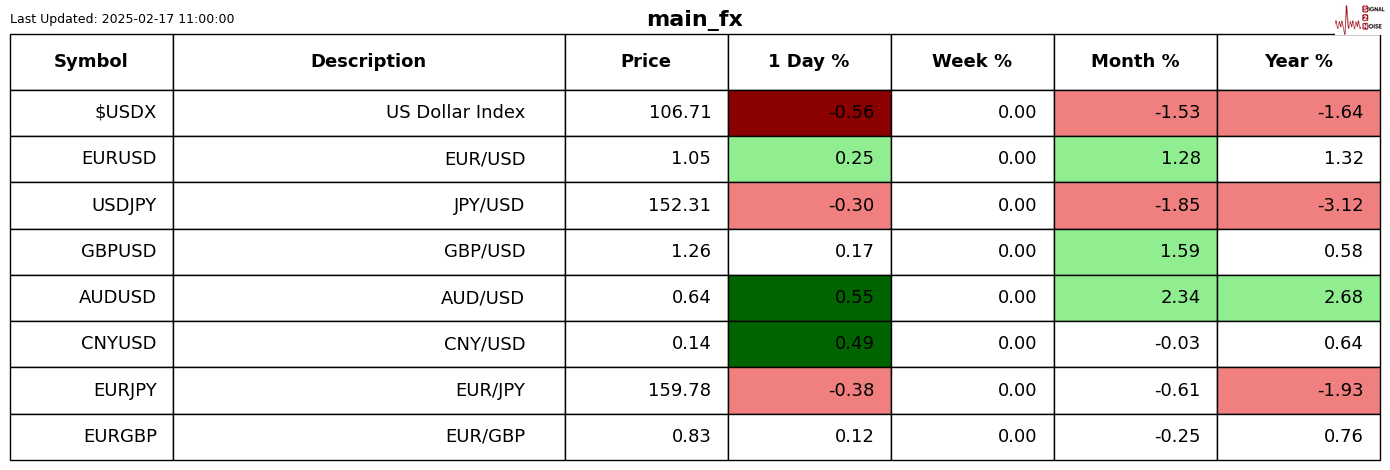
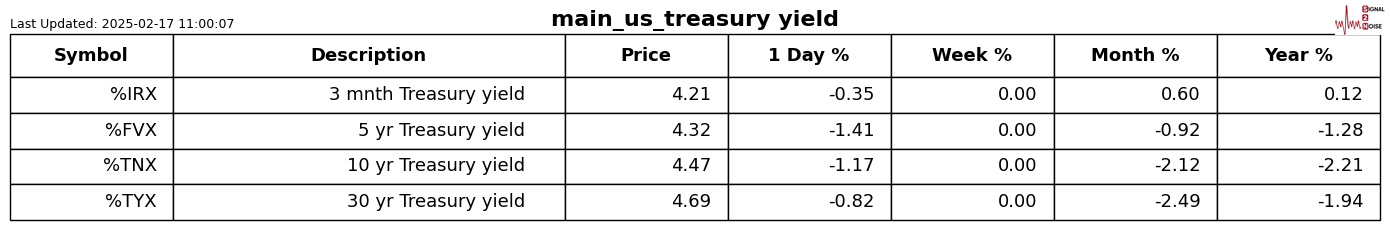
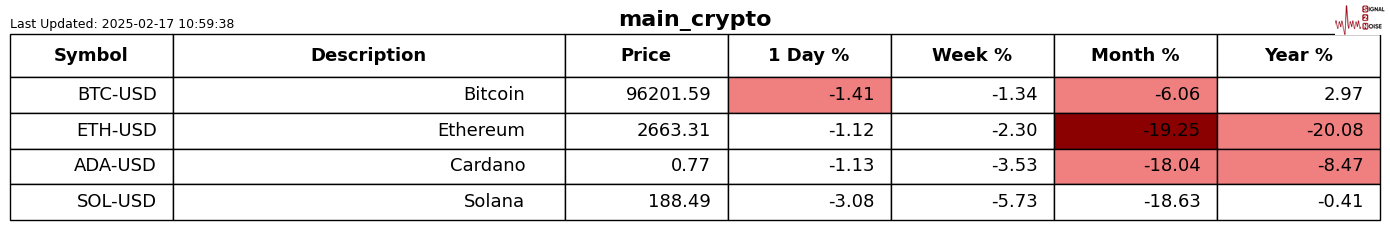
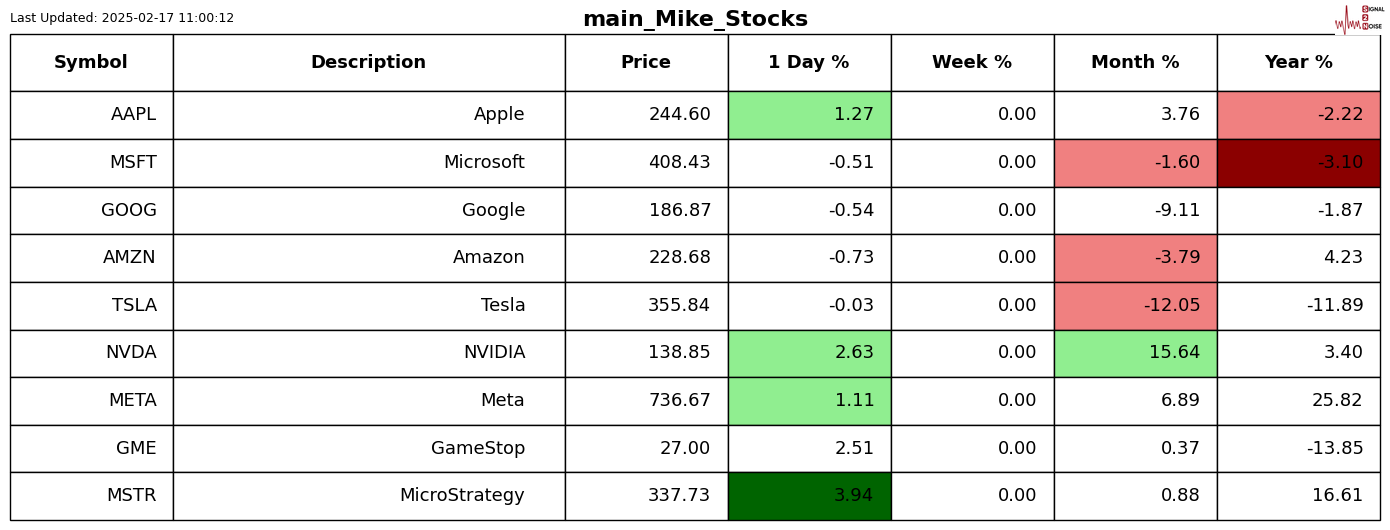
For those who are new to the letter, the shading is Z-Score adjusted so that only moves bigger than usual for the symbol are highlighted.
Chart gallery
News today
Author

Michael Berman, PhD
Signal2Noise (S2N) News
Michael has decades of experience as a professional trader, hedge fund manager and incubator of emerging traders.


