Introduction
VolatilityMarkets Trend Following Trade.
According to AQR the quantitative hedge fund and Yale University, over the past 100 years markets moved in trends. Trends are successive upwards and downwards movements in price that occur at a greater frequency than would be predicted by randomness alone. The following trade idea is a trend following trade idea which takes the assumption that the market will continue moving in the way it has over the previous sessions. Trend Trading, however is different than scalping due to the time horizon of the trade as trend following trades will take a week while scalping is done on a daily or intraday basis.
Market summary
Price
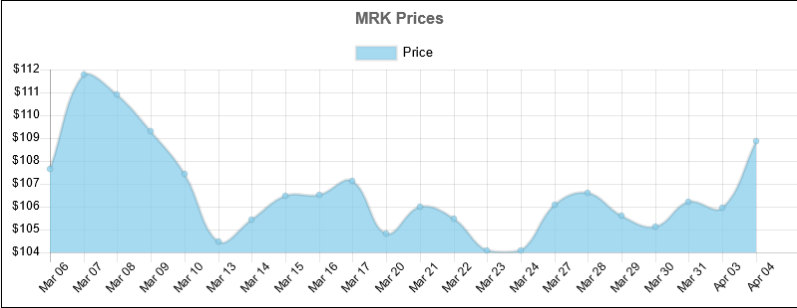
Merck last price was $ 108.87.
Trend analysis
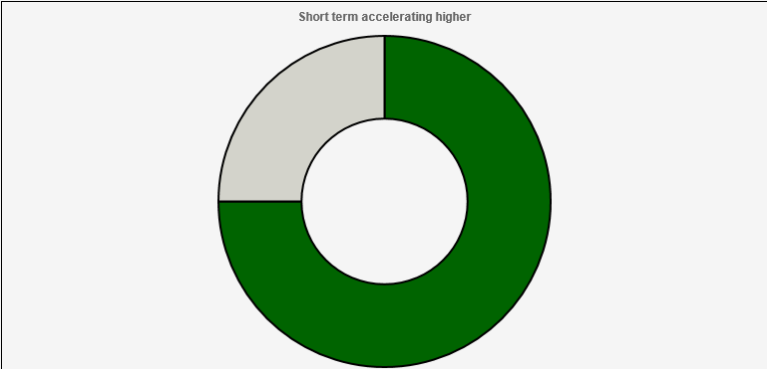
In the short term Merck has been accelerating higher. In the long term Merck has been decelerating higher.
Value analysis
Over the past 21 days, the Merck price increased 10 days and decreased 11 days.
For every up day, there were 1.1 down days.
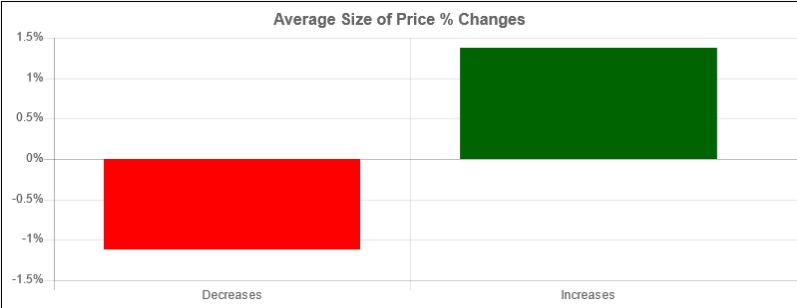
The average return on days where the price increased is 1.3711%
The average return on days where the price decreased is -1.1214%
Performance
Over the past 21 Days, the price has increased by 1.12% percent.
Over the past 21 days, the average return per day has been 0.0533% percent.
Trade idea
Taking into account the long term trend decelerating higher, we propose a long trade idea with an overnight time horizon..
Trend trade idea
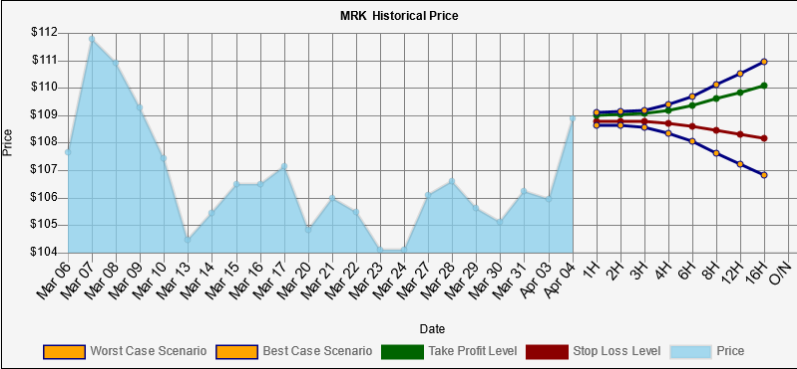
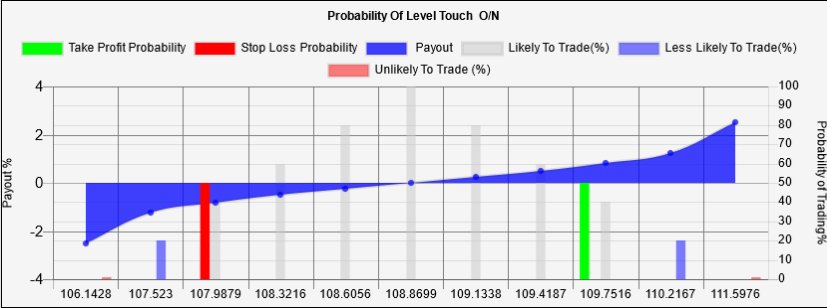
Buy $ 154,191 USD of Merck, take profit at $ 110.0786 level with 50.02% odds for a $ 1,711 USD gain, stop out at $ 108.1639 with 50.0% odds for a $ 1,000 USD loss through an overnight time horizon.
Intraday predictions
Merck trend analysis
Merck last price was $ 108.87. The short term trend accelerating higher is stronger than the long term trend decelerating higher. This trade goes long when the last change was higher and accelerating .
Merck value analysis
Over the past 21 days, the Merck price increased 10 days and decreased 11 days. For every up day, there were 1.1 down days. The average return on days where the price increased is 1.3711% The average return on days where the price decreased is -1.1214% Over the past 21 Days, the price has increased by 1.12% percent. Over the past 21 days, the average return per day has been 0.0533% percent.
Merck worst/best case scenario analysis
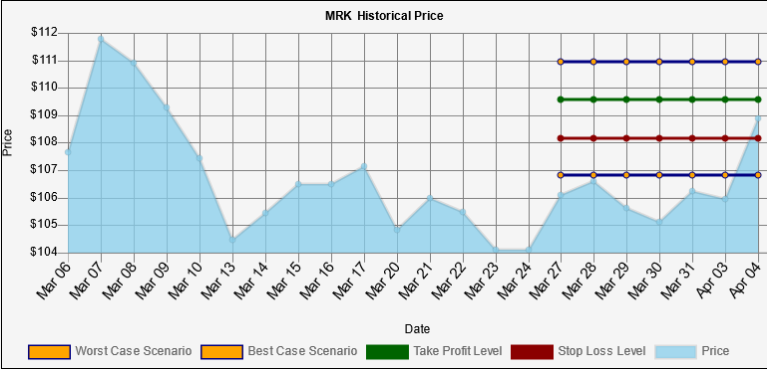
Within 1 week, our worst case scenario where we are 95% certain that this level won't trade for Merck, is $ 106.8018 , and the best case scenario overnight is $ 110.9382 . levels outside of this range are unlikely, but still possible, to trade. We are 50% confident that $ 108.1639 could trade and that $ 110.0786 could trade. These levels are within statistical probability.
Expected range
Within 1 week, our worst case scenario where we are 95% certain that this level won't trade for MRK, is $ 106.8018 , and the best case scenario overnight is $ 110.9382 . levels outside of this range are unlikely, but still possible, to trade.
We are 50% confident that $ 108.1639 could trade and that $ 110.0786 could trade. These levels are within statistical probability.
Probability Vs Payout Chart:
This graph contrasts the percentage payout of holding a position vs the probability that the payout occurs. The red and green columns represent the probability of stopping out and taking profit and their associated payouts.
Key Takeaways:
-
Price today $ 108.87
-
Over the past 21 days, the Merck price increased 10 days and decreased 11 Days.
-
For every up day, there were 1.1 down days.
-
The average return on days where the price increased is 1.3711%
-
The average return on days where the price decreased is -1.1214%
-
Over the past 21 Days, the price has increased by 1.12% percent.
-
Over the past 21 days, the average return per day has been 0.0533% percent.
-
Over the past 21 days, The price has on average been decelerating: $ -0.0595 per day higher
-
Over the last session, the price increased by $ 2.92
-
Over the last session, the price increased by 2.6821 %
-
Over the last session, the price accelerated by $ 2.64
Volatility Markets provides trend following trade ideas for momentum traders. The Volatility Markets Newswire measures the direction and acceleration of a security and then structures a trade idea to capitalize on the trend. While trends have been shown to exist in markets over the past 100 years, they are no guarantee of future asset prices. You should take these ideas lightly and at your own risk.
Recommended content
Editors’ Picks
AUD/USD: Next on the downside comes 0.6500
Further gains in the US Dollar kept the price action in commodities and the risk complex depressed on Tuesday, motivating AUD/USD to come close to the rea of the November low near 0.6500.
EUR/USD pierces 1.06, finds lowest bids in a year
EUR/USD trimmed further into low the side on Tuesday, shedding another third of a percent. Fiber briefly tested below 1.0600 during the day’s market session, and the pair is poised for further losses after a rapid seven-week decline from multi-month highs set just above 1.1200 in September.

Gold struggles to retain the $2,600 mark
Following the early breakdown of the key $2,600 mark, prices of Gold now manages to regain some composure and reclaim the $2,600 level and beyond amidst the persistent move higher in the US Dollar and the rebound in US yields.

Ripple could rally 50% following renewed investor interest
Ripple's XRP rallied nearly 20% on Tuesday, defying the correction seen in Bitcoin and Ethereum as investors seem to be flocking toward the remittance-based token. XRP could rally nearly 50% if it sustains a firm close above the neckline resistance of an inverted head and shoulders pattern.
Five fundamentals: Fallout from the US election, inflation, and a timely speech from Powell stand out Premium
What a week – the US election lived up to their hype, at least when it comes to market volatility. There is no time to rest, with politics, geopolitics, and economic data promising more volatility ahead.

Best Forex Brokers with Low Spreads
VERIFIED Low spreads are crucial for reducing trading costs. Explore top Forex brokers offering competitive spreads and high leverage. Compare options for EUR/USD, GBP/USD, USD/JPY, and Gold.
