MercadoLibre Inc. (MELI) Elliott Wave technical analysis [Video]
![MercadoLibre Inc. (MELI) Elliott Wave technical analysis [Video]](https://editorial.fxstreet.com/images/Markets/Equities/HangSeng/stock-market-38974104_XtraLarge.jpg)
MELI Elliott Wave Analysis Trading Lounge.
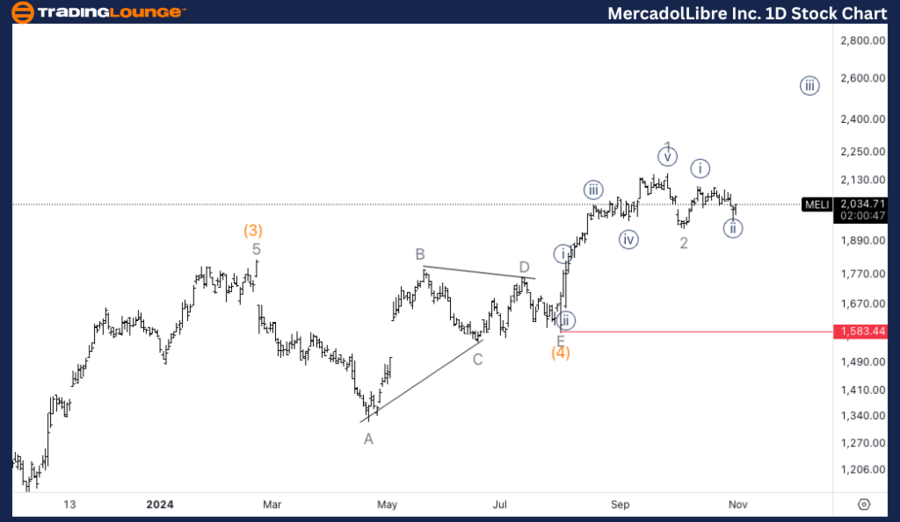
MercadoLibre Inc., (MELI) Daily Chart.
MELI Elliott Wave Technical Analysis
Function: Trend.
Mode: Impulsive.
Structure: Motive.
Position: Wave 3 of (5).
Direction: Upside in wave 3.
Details: Looking for continuation higher in wave (5) which given the length of wave 1 could easily reach the next TradingLevels at 3000$.
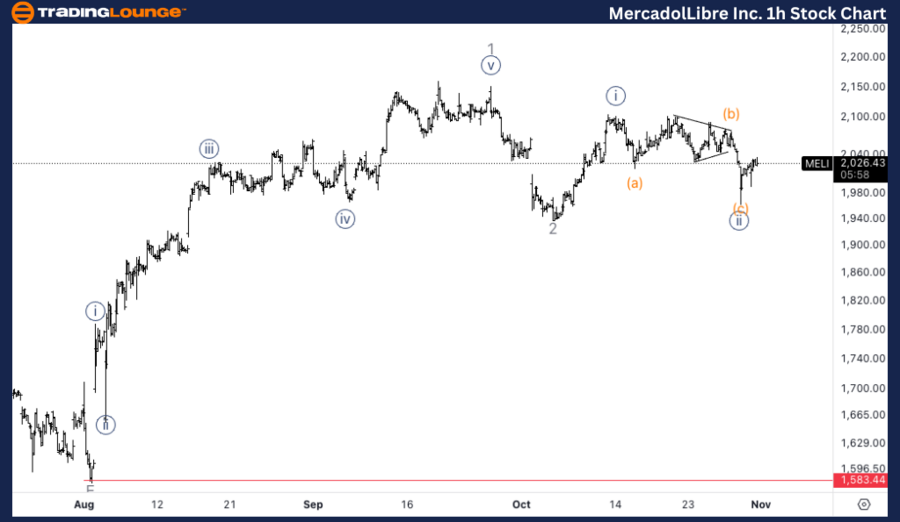
MercadoLibre Inc., (MELI) 1H Chart
MELI Elliott Wave technical analysis
Function: Trend.
Mode: Impulsive.
Structure: Motive.
Positoin: Wave {ii} of 3.
Direction: Bottom in wave {ii}
Details: Looking for a wave {ii} as we seem to have what appears to be a triangle in wave (b), therefore a three wave move that fits the wave {ii} narrative.
This analysis of MercadoLibre Inc., (MELI) focuses on both the daily and 1-hour charts, using the Elliott Wave Theory to assess current market trends and forecast future price movements.
MELI Elliott Wave technical analysis – Daily chart
The daily chart analysis indicates that MELI is currently in wave 3 of (5), showing strong momentum. This wave is expected to continue moving higher, with targets possibly reaching $3000 based on the length of previous movements. The outlook remains bullish, and traders should watch for signs of further upside.
MELI Elliott Wave technical analysis – One-hour chart
On the 1-hour chart, MELI appears to be in the corrective phase of wave {ii} of the ongoing advance. The formation of what looks like a triangle in wave (b) supports the narrative of a three-wave corrective structure. The expectation is for this correction to complete, setting up for a continuation higher in wave {iii}.
Technical analyst: Alessio Barretta.
MELI Elliott Wave technical analysis [Video]
Author

Peter Mathers
TradingLounge
Peter Mathers started actively trading in 1982. He began his career at Hoei and Shoin, a Japanese futures trading company.


