McDonald’s Corp. stocks Elliott Wave technical analysis [Video]
![McDonald’s Corp. stocks Elliott Wave technical analysis [Video]](https://editorial.fxstreet.com/images/Markets/Equities/Industries/DiversifiedFinancials/calculating-637322940397936981_XtraLarge.jpg)
MCD Elliott Wave Analysis Trading Lounge.
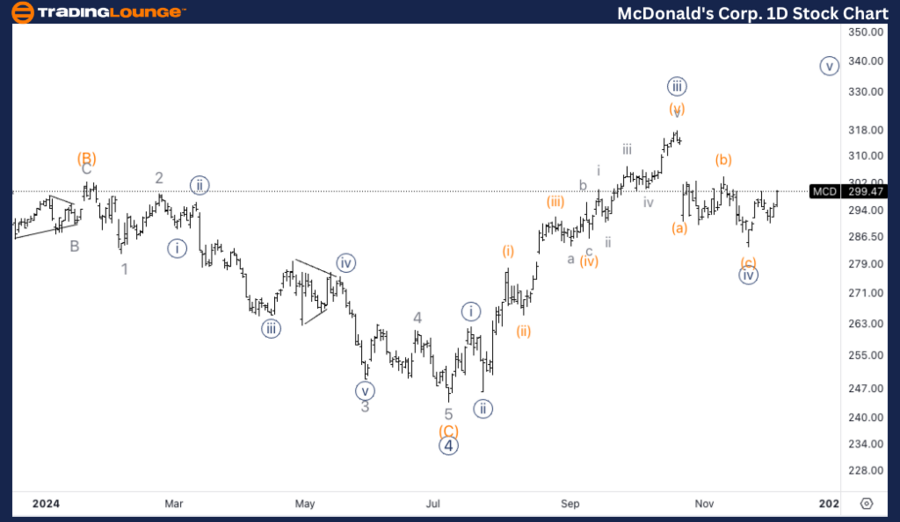
McDonald’s Corp., (MCD) Daily Chart.
MCD Elliott Wave technical analysis
Function: Trend.
Mode: Impulsive.
Structure: Motive.
Position: Wave {v} of 1.
Direction: Upside in wave {v}.
Details: We are looking for a top in wave 1 of (1) or what could also easily be wave (1) of Primary 5 as we have been trading around TradingLevel3 at 300$.
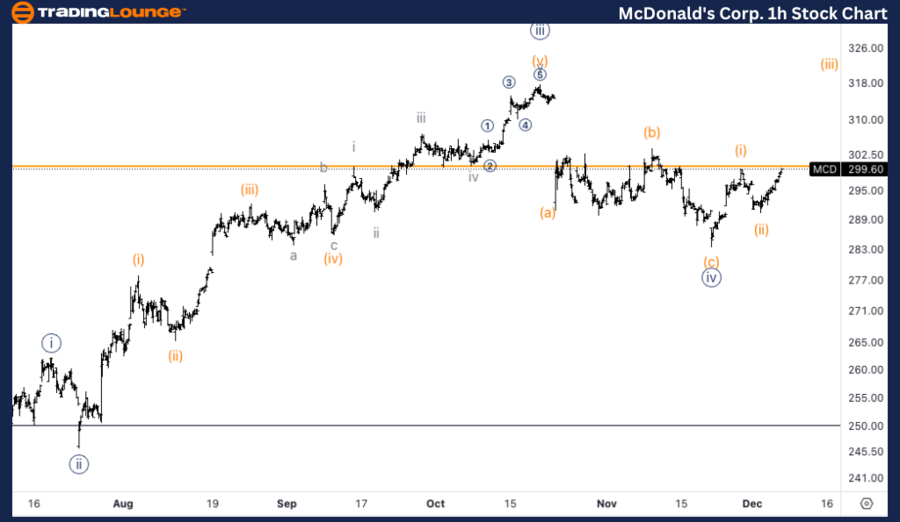
McDonald’s Corp., (MCD) 1H Chart
MCD Elliott Wave technical analysis
Function: Trend.
Mode: Impulsive.
Structure: Motive.
Position: Wave (iii) of {v}.
Direction: Upside in wave (iii).
Details: Looking for upside into wave (iii) as we approach once again 300$. Ideally looking for a classic trading level around 300$ to then confirm the long position towards ATH.
This analysis of McDonald’s Corp., (MCD) focuses on both the daily and 1-hour charts, using the Elliott Wave Theory to assess current market trends and forecast future price movements.
MCD Elliott Wave technical analysis – Daily chart
MCD is advancing within wave {v} of wave 1 (or potentially wave (1) of Primary 5), as it trades around the significant resistance level at $300, which corresponds to TradingLevel3. This area is critical, as it could mark the completion of this impulsive wave or set up for the next phase in a larger bullish structure. A potential top formation around this level could indicate either the completion of wave 1 or an extended move higher in Primary wave 5.
MCD Elliott Wave technical analysis – One-hour chart
On the 1-hour chart, MCD is progressing in wave (iii) of {v}, with a clear upside momentum as it approaches the key $300 mark once again. The current price action suggests that MCD is likely to continue higher in wave (iii), and a decisive break above $300 would confirm the bullish case, with potential targets towards an All-Time High (ATH).
Technical analyst: Alessio Barretta.
MCD Elliott Wave technical analysis [Video]
Author

Peter Mathers
TradingLounge
Peter Mathers started actively trading in 1982. He began his career at Hoei and Shoin, a Japanese futures trading company.


