|

McDonald's Corp. (MCD) Elliott Wave technical analysis [Video]

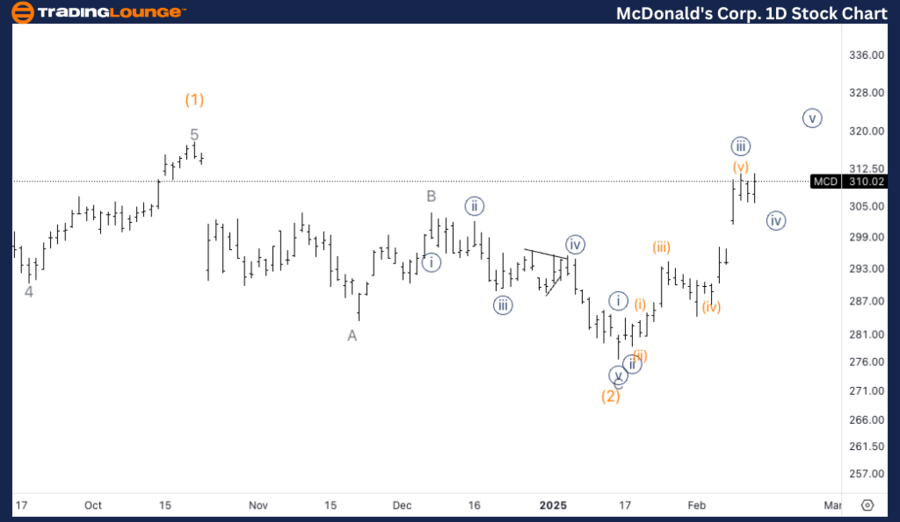
MCD Elliott Wave technical analysis - Daily chart

  • Function: Trend.

  • Mode: Impulsive.

  • Structure: Motive.

  • Position: Wave 1 of (3).

  • Direction: Approaching a top in wave 1.

  • Details: Expecting a top in minor wave 1, ideally near the previous wave (1) high, followed by a pullback before resuming the uptrend above $300.

Daily chart summary

MCD is currently in the final stage of impulsive wave 1 of (3). We anticipate a top forming soon in minor wave 1, likely near the previous wave (1) high. After reaching this peak, we expect a pullback before resuming the uptrend, with a target above $300 in subsequent waves.

MCD

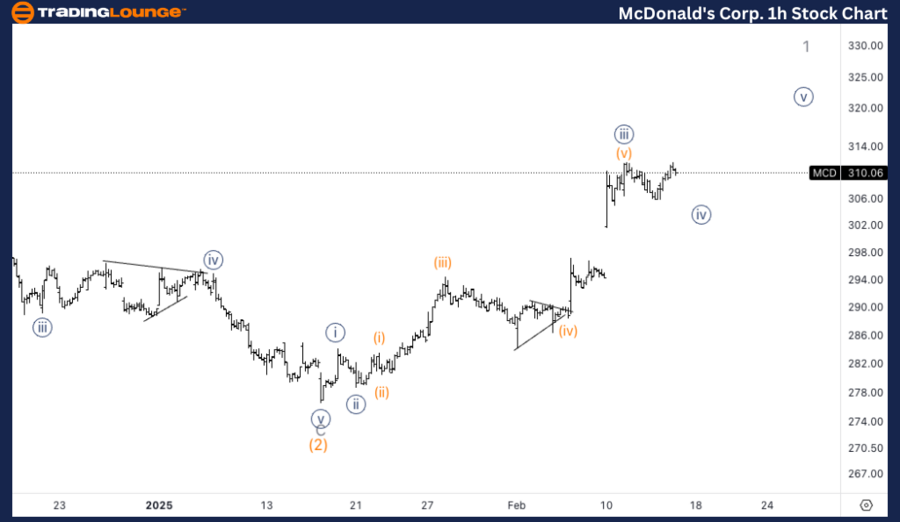
MCD Elliott Wave technical analysis - One-hour chart

  • Function: Trend.

  • Mode: Impulsive.

  • Structure: Motive.

  • Position: Wave {iv} of 1.

  • Direction: Bottoming in wave {iv}.

  • Details: Wave 1 is subdividing, and we expect another push higher into wave {v} to complete the current uptrend.

One-hour chart summary

On the 1-hour chart, MCD is currently in wave {iv} of 1. A correction is expected to complete, followed by another push higher into wave {v}, signaling the completion of wave 1’s current uptrend. This final movement will confirm minor wave 1’s top.

MCD

McDonald's Corp. (MCD) market outlook

This analysis of McDonald's Corp. (MCD) examines both the daily and 1-hour charts using Elliott Wave Theory to assess current market trends and forecast future price movements.

McDonald's Corp. (MCD) Elliott Wave technical analysis [Video]

Author

Peter Mathers

Peter Mathers

TradingLounge

Peter Mathers started actively trading in 1982. He began his career at Hoei and Shoin, a Japanese futures trading company.

More from Peter Mathers
Share:

Editor's Picks

EUR/USD looks offered below 1.1900

EUR/USD keeps its bearish tone unchanged ahead of the opening bell in Asia, returning to the sub-1.1900 region following a firmer tone in the US Dollar. Indeed, the pair reverses two consecutive daily gains amid steady caution ahead of Wednesday’s key US Nonfarm Payrolls release.
 

GBP/USD slips back to daily lows near 1.3640

GBP/USD drops to daily lows near 1.3640 as sellers push harder and the Greenback extends its rebound in the latter part of Tuesday’s session. Looking ahead, the combination of key US releases, including NFP and CPI, alongside important UK data, should keep the pound firmly in focus over the coming days.

Gold the battle of wills continues with bulls not ready to give up

Gold remains on the defensive and approaches the key $5,000 region per troy ounce on Tuesday, giving back part of its recent two day. The precious metal’s pullback unfolds against a firmer tone in the US Dollar, declining US Treasury yields and steady caution ahead of upcoming key US data releases.

Bitcoin's downtrend caused by ETF redemptions and AI rotation: Wintermute

Bitcoin's (BTC) fall from grace since the October 10 leverage flush has been spearheaded by sustained ETF outflows and a rotation into the AI narrative, according to Wintermute.

Dollar drops and stocks rally: The week of reckoning for US economic data

Following a sizeable move lower in US technology Stocks last week, we have witnessed a meaningful recovery unfold. The USD Index is in a concerning position; the monthly price continues to hold the south channel support.

XRP holds $1.40 amid ETF inflows and stable derivatives market

Ripple trades under pressure, with immediate support at $1.40 holding at the time of writing on Tuesday. A recovery attempt from last week’s sell-off to $1.12 stalled at $1.54 on Friday, leading to limited price action between the current support and the resistance.