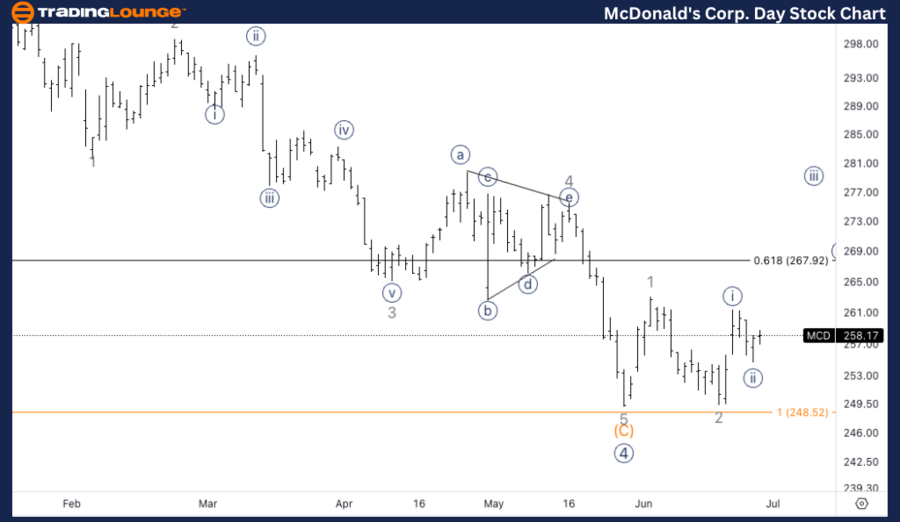
McDonald’s Corp., (MCD) Daily Chart.

MCD Elliott Wave technical analysis

Function: Trend

Mode: Impulsive

Structure: Motive

Position: Wave 3 of (1).

Direction: Upside in wave 3.  

Details: Looking for a potential bottom in Intermediate wave (C). Looking for a series of ones and twos before accelerating higher in wave three. 

MCD Elliott Wave technical analysis – Daily chart

We are looking for a potential bottom in Intermediate wave (C) and a development of a series of smaller waves (ones and twos) before wave 3 accelerates higher. This sequence indicates that wave 3 should exhibit a strong bullish momentum as it progresses. The key area to watch is the base of wave (C), which provides a critical support level for the anticipated upward move in wave 3.

MCD

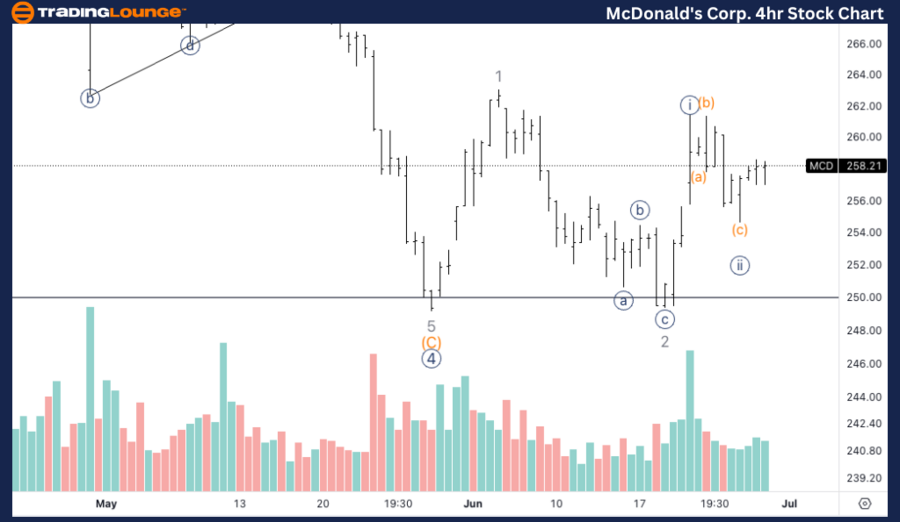
MCD Elliott Wave technical analysis – Four-hour chart

We are expecting further acceleration higher if we are in the third wave of a third wave scenario. This implies strong bullish momentum and volume, which aligns with the wave count and suggests a continuation of the upward trend. Volume analysis supports this bullish outlook, indicating increased buying pressure that typically accompanies third waves, especially in the third wave of the sequence.

Function: Trend

Mode: Impulsive

Structure: Motive

Position: Wave {iii} of 3.  

Direction: Upside in {iii}.

Details: Looking for an acceleration higher if we are in a third of a third. Volume seems to be suggesting a bullish scenario as well.

MCD

This Elliott Wave analysis for McDonald’s Corp. (MCD), explores the current market structure and future potential movements based on Elliott Wave principles. We provide insights from both the daily and 4-hour charts to offer a detailed view of MCD's price action and anticipated trends.

McDonald’s Corp. (MCD) Elliott Wave technical analysis [Video]

Share: Feed news

As with any investment opportunity there is a risk of making losses on investments that Trading Lounge expresses opinions on.

Historical results are no guarantee of future returns. Some investments are inherently riskier than others. At worst, you could lose your entire investment. TradingLounge™ uses a range of technical analysis tools, software and basic fundamental analysis as well as economic forecasts aimed at minimizing the potential for loss.

The advice we provide through our TradingLounge™ websites and our TradingLounge™ Membership has been prepared without considering your objectives, financial situation or needs. Reliance on such advice, information or data is at your own risk. The decision to trade and the method of trading is for you alone to decide. This information is of a general nature only, so you should, before acting upon any of the information or advice provided by us, consider the appropriateness of the advice considering your own objectives, financial situation or needs. Therefore, you should consult your financial advisor or accountant to determine whether trading in securities and derivatives products is appropriate for you considering your financial circumstances.

Recommended content


Recommended content

Editors’ Picks

EUR/USD retreats to 1.0700 area following post-PCE jump

EUR/USD retreats to 1.0700 area following post-PCE jump

After spiking to a daily high of 1.0720 with the immediate reaction to US PCE inflation data, EUR/USD lost its traction and declined to the 1.0700 area. Investors remain cautious ahead of this weekend's French election and make it difficult for the Euro to gather strength.

EUR/USD News

GBP/USD stays below 1.2650 after US inflation data

GBP/USD stays below 1.2650 after US inflation data

GBP/USD struggles to preserve its bullish momentum and trades below 1.2650 in the American session on Friday. Earlier in the day, the data from the US showed that the annual core PCE inflation declined to 2.6% in May, limiting the USD's upside and helping the pair hold its ground.

GBP/USD News

Gold keeps its daily gains near $2,330 following US PCE data

Gold keeps its daily gains near $2,330 following US PCE data

Gold prices maintain their constructive bias around $2,330 after US inflation readings gauged by the PCE matched consensus in May and US yields advance slightly across the curve.

Gold News

BTC struggles around the $62,000 level

BTC struggles around the $62,000 level

Bitcoin price faces pullback resistance at the lower band of the descending wedge around $62,000. Ethereum price finds support at $3,288, the 61.8% Fibonacci retracement level. Ripple price faces resistance at $0.500, its daily resistance level.

Read more

French Elections Preview: Euro to suffer after the calm, as specter of extremists, uncertainty rise Premium

French Elections Preview: Euro to suffer after the calm, as specter of extremists, uncertainty rise

The first round of French parliamentary elections is set to trigger high uncertainty. Soothing messages from the far right and far left leave the Euro vulnerable to falls. Calm may return only after the second round of voting on  July 7.

Read more

Forex MAJORS

Cryptocurrencies

Signatures