MA Elliott Wave technical analysis
Function: Trend.
Mode: Impulsive.
Structure: Motive.
Position: Minor wave 5.
Direction: Top in wave 5.
Details: Here we are presenting the possibility of further upside into wave 5 as we could be in the making of wave {ii} of 5, or else we could have a top in wave 5 of (3) in place and we are looking for a larger pullback in wave (4).
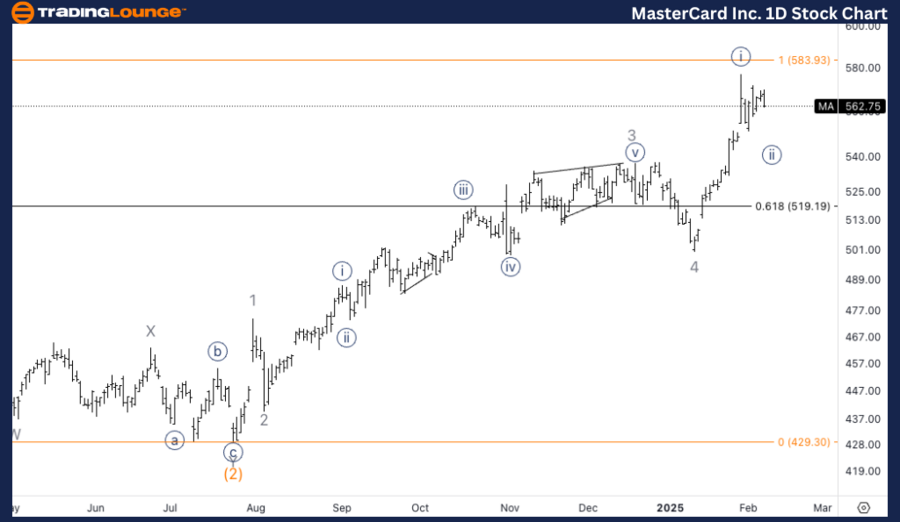
MA Elliott Wave technical analysis – Daily chart
Mastercard Inc. (MA) is currently unfolding in an impulsive structure, with the focus on minor wave 5. There are two potential scenarios for wave 5: either we are still progressing higher, and currently in wave {ii} of 5, indicating further upside to come, or we have already completed wave 5 of (3) and could be facing a larger pullback in wave (4). Monitoring the price action near key resistance levels will be crucial to determine the dominant scenario.
MA Elliott Wave technical analysis
Function: Trend
Mode: Impulsive
Structure: Motive
Position: Wave (b) of {ii}.
Direction: Downside into wave ©.
Details: We are looking for a top in wave {i} as we seem to be correcting in wave {ii}. We are looking for further developments in wave {ii}, specifically the end of wave (b) and then a down move in wave (c). The increase volume on the top could suggest the alternate count is in place and we have a top in wave 5.
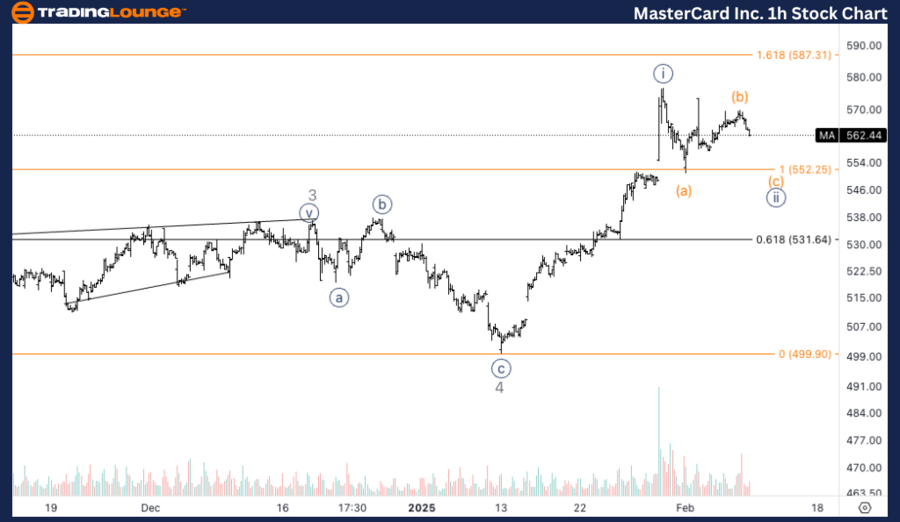
MA Elliott Wave technical analysis – One-hour chart
In the 1-hour chart, MA is likely correcting in wave {ii}, having just completed wave {i}. We are now anticipating further downside development into wave (c) of {ii}, as wave (b) seems to be nearing completion. The recent volume spike at the top may suggest that the alternate count could be in play, meaning wave 5 has already completed, signaling a more significant correction may be underway.
This Elliott Wave analysis for Mastercard Inc. (MA) examines both the daily and 1-hour charts to assess its current market trend, utilizing Elliott Wave Theory to anticipate potential future movements.
Mastercard Inc. (MA) Elliott Wave technical analysis [Video]
As with any investment opportunity there is a risk of making losses on investments that Trading Lounge expresses opinions on.
Historical results are no guarantee of future returns. Some investments are inherently riskier than others. At worst, you could lose your entire investment. TradingLounge™ uses a range of technical analysis tools, software and basic fundamental analysis as well as economic forecasts aimed at minimizing the potential for loss.
The advice we provide through our TradingLounge™ websites and our TradingLounge™ Membership has been prepared without considering your objectives, financial situation or needs. Reliance on such advice, information or data is at your own risk. The decision to trade and the method of trading is for you alone to decide. This information is of a general nature only, so you should, before acting upon any of the information or advice provided by us, consider the appropriateness of the advice considering your own objectives, financial situation or needs. Therefore, you should consult your financial advisor or accountant to determine whether trading in securities and derivatives products is appropriate for you considering your financial circumstances.
Recommended content
Editors’ Picks

EUR/USD attacks 1.0800 ahead of EU inflation data
EUR/USD is battling 1.0800 in the early European session on Tuesday, undermined by the latest US Dollar bounce. Traders keenly await the EU inflation data and the US jobs survey for further impetus as US President Trump's 'reciprocal tariffs' announcement looms on Wednesday.

GBP/USD treads water above 1.2900 ahead of US data, tariffs
GBP/USD is trading on the defensive while holding above 1.2900 in Tuesday's European trading. The pair loses ground amid a modest US Dollar uptick as traders resort to repositioning in the lead-up to the top-tier US economic data releases and Wednesday's tariffs announcements.

Gold price extends bullish trend amid rising trade tensions; fresh record high and counting
Gold price continues to scale new record highs for the fourth straight day on Tuesday. Worries about the widening global trade war and geopolitical risks boost the commodity. Fed rate cut bets weigh on the USD and further benefit the non-yielding yellow metal.

PEPE could rally to double digits if it breaks above its key resistance level
Pepe memecoin approaches its descending trendline, trading around $0.000007 on Tuesday; a breakout indicates a bullish move ahead. Moreover, PEPE's long-to-short ratio supports a bullish thesis as bullish bets among the traders reach the highest over a month.

Is the US economy headed for a recession?
Leading economists say a recession is more likely than originally expected. With new tariffs set to be launched on April 2, investors and economists are growing more concerned about an economic slowdown or recession.

The Best brokers to trade EUR/USD
SPONSORED Discover the top brokers for trading EUR/USD in 2025. Our list features brokers with competitive spreads, fast execution, and powerful platforms. Whether you're a beginner or an expert, find the right partner to navigate the dynamic Forex market.