Maruti Suzuki India Elliott Wave technical analysis [Video]
![Maruti Suzuki India Elliott Wave technical analysis [Video]](https://editorial.fxstreet.com/images/Markets/Equities/Industries/Transportation/road-transport-truck-637435358188416671_XtraLarge.jpg)
Maruti Elliott Wave technical analysis
Function: Counter Trend Lower (Intermediate degree, orange).
Mode: Corrective.
Structure: Impulse, within larger degree Wave A.
Position: Minute Wave ((iii)) Navy.
Details: Minute Wave ((iii)) is now progressing lower against 13680, as an extension.
Invalidation point: 13680-85.
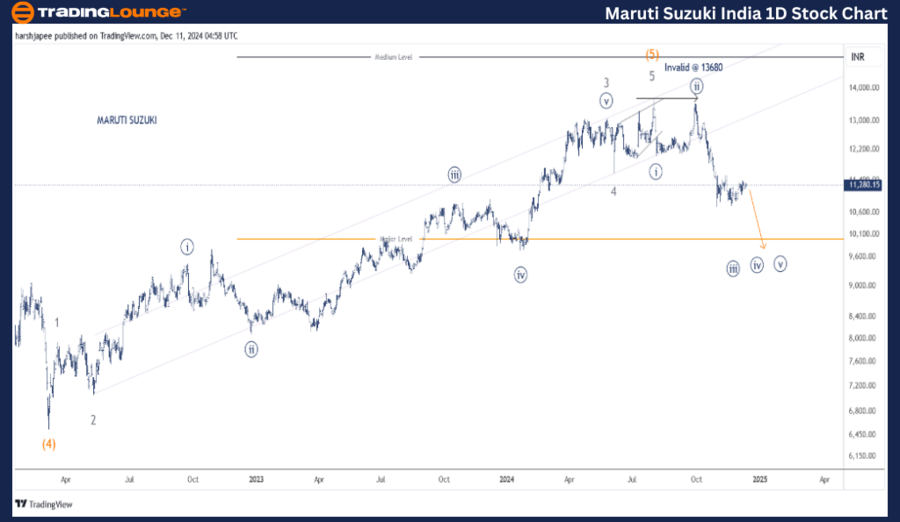
Maruti Suzuki daily chart technical analysis and potential Elliott Wave counts
MARUTI SUZUKI daily chart is indicating a potential trend reversal after terminating Minor Wave 5 Grey of Intermediate Wave (5) Orange around 13680 high. The stock is about to complete its first impulse wave lower as the Minute sub waves unfold against 13680 resistance.
The stock had dropped through 6530 lows in March 2022, terminating Intermediate Wave (4) Orange. The subsequent rally can be clearly seen unfolding as an impulse marked as Minor Waves 1 through 5 Grey. Please note Wave 3 was an extension while Wave 5 completed as a diagonal.
If the above is correct, a major top seems to be in place around 13680 levels as the first impulse drop continues to unfold.
Maruti Suzuki India – Elliott Wave technical analysis
Function: Counter Lower (Intermediate degree, orange).
Mode: Corrective.
Structure: Impulse, within larger degree Wave A.
Position: Minute Wave ((iii)) Navy.
Details: Minute Wave ((iii)) is now progressing lower against 13680, as an extension. Furthermore Minuette Wave (iv) could be unfolding as a triangle now.
Invalidation point: 13680-85.
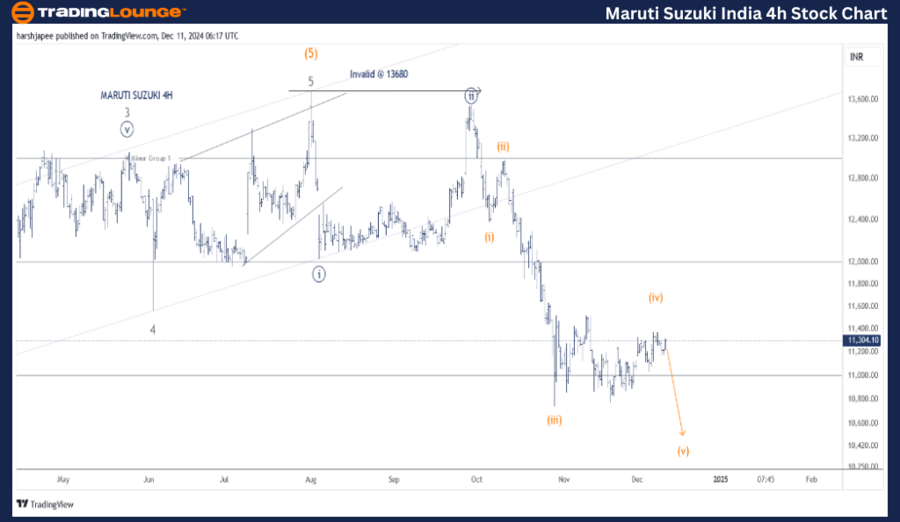
Maruti Suzuki four-hour chart technical analysis and potential Elliott Wave counts
MARUTI SUZUKI 4H chart is highlighting the sub-waves after Minor Wave 3 Grey terminated around 13065 mark. Minor Wave 4 unfolded as a zigzag, terminating around 11,540 mark. Minor Wave 5 pushed through 13680 unfolding as an ending diagonal.
The stock has reversed sharply from 13680 levels and is unfolding as an impulse with Minute Waves ((i)) and ((ii)) in place already around 12060 and 13600-50 levels respectively. If the above holds well, prices would continue dragging lower as Minute Wave ((iii)) extends.
Conclusion
MARUTI SUZUKI is progressing lower within Minute Wave ((iii)) Navy against 13680 high.
Maruti Suzuki India Elliott Wave technical analysis [Video]
Author

Peter Mathers
TradingLounge
Peter Mathers started actively trading in 1982. He began his career at Hoei and Shoin, a Japanese futures trading company.