Maruti Suzuki India Elliott Wave technical analysis [Video]
![Maruti Suzuki India Elliott Wave technical analysis [Video]](https://editorial.fxstreet.com/images/Markets/Equities/Industries/Transportation/truck-transport_XtraLarge.jpg)
Maruti Elliott Wave technical analysis
Function: Counter Trend Lower (Intermediate degree, orange).
Mode: Corrective.
Structure: Impulse, within larger degree Wave A.
Position: Minute Wave ((ii)) Navy complete.
Details: Minute Wave ((ii)) looks complete just below 12700-800 zone. Furthermore, Minute Wave ((iii)) Navy seems to be progressing now.
Invalidation point: 13680-85.
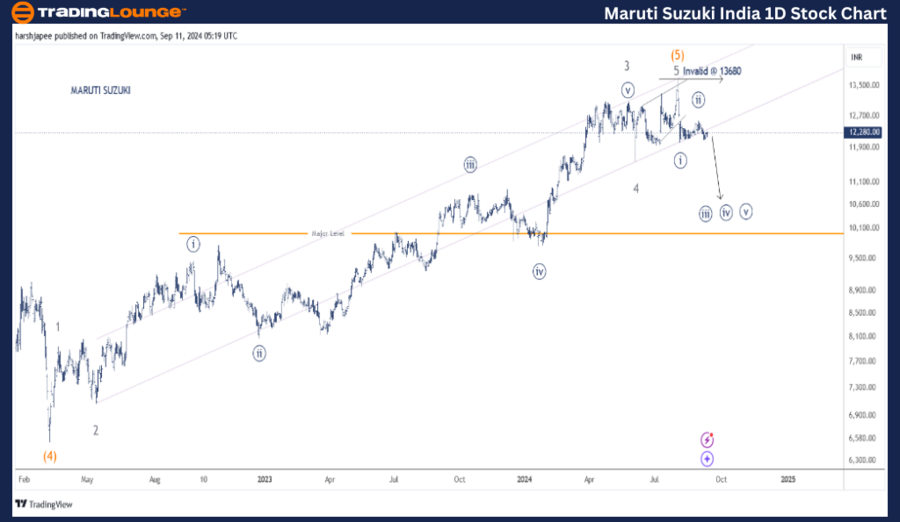
Maruti Suzuki daily chart technical analysis and potential Elliott Wave counts
Maruti Suzuki daily chart suggests a major top is in place around 13680-85 zone, registered on August 01, 2024. The stock has dropped through 12040 lows marked as Minute Wave ((i)), followed by a shallow rally towards 12600-700 range, potential Minute Wave ((ii)).
Earlier, the stock produced an impulse wave between 6500 and 13680 levels, which is marked as Intermediate Wave (5) Orange complete. Also note Minor Waves 1 through 5 Grey complete, with Wave 5 terminating as a diagonal.
With Minute Waves ((i)) and ((ii)) potentially in place around 12040 and 12600-700 respectively; bears would be inclined to come back in control and resume Minute Wave ((iii)) lower through 9500 mark in the medium term.
Maruti Suzuki India Elliott Wave technical analysis
Function: Counter Trend Lower (Intermediate degree, orange).
Mode: Corrective.
Structure: Impulse, within larger degree Wave A.
Position: Minute Wave ((ii)) Navy complete.
Details: Minute Wave ((ii)) looks complete just below 12700-800 zone. Furthermore, Minute Wave ((iii)) Navy seems to be progressing now. Alternatively, prices could drift a bit more sideways before Minute Wave ((ii)) terminates.
Invalidation point: 13680-85.
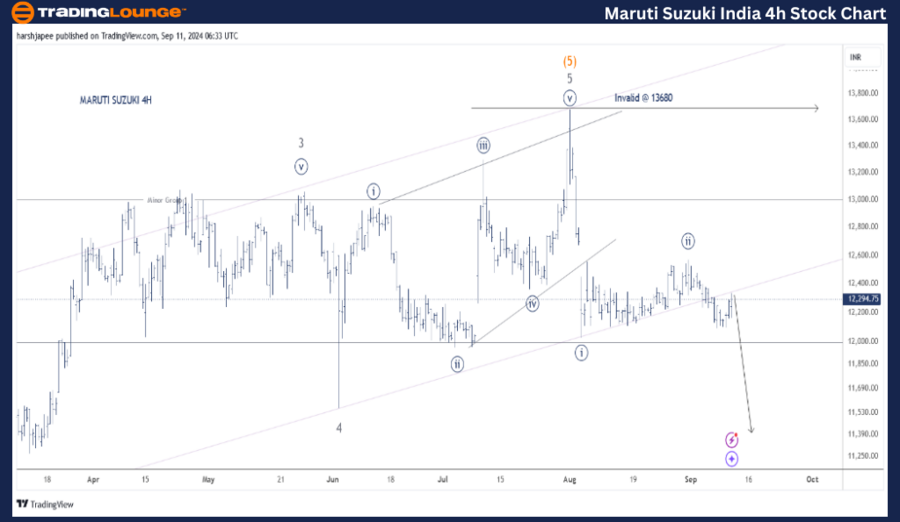
Maruti Suzuki four-hour chart technical analysis and potential Elliott Wave counts
Maruti Suzuki 4H chart highlights the lower degree waves within Minor Wave 5 Grey. Minute Waves ((i)) through ((v)) Navy complete the ending diagonal minor Wave 5 around 13680 levels before prices reversed sharply lower.
Furthermore, Minute Wave ((i)) is now in place around 12040, along with Minute Wave ((ii)) around 12600-700 zone. If the above holds well, Minute Wave ((iii)) is now underway against 13680 high.
Conclusion
Maruti Suzuki is potentially progressing within Minute Wave ((iii)) Navy within Minor Wave 1 Grey against 13680 mark.
Maruti Suzuki India Elliott Wave technical analysis [Video]
Author

Peter Mathers
TradingLounge
Peter Mathers started actively trading in 1982. He began his career at Hoei and Shoin, a Japanese futures trading company.