Market breadth divergence: Bullish or bearish? [Video]
![Market breadth divergence: Bullish or bearish? [Video]](https://editorial.fxstreet.com/images/Markets/Equities/HangSeng/hang-seng-index-17452117_XtraLarge.jpg)
Watch the free-preview video above extracted from the WLGC session before the market opens on 18 Jun 2024 to find out the following:
-
What does the divergence between the S&P 500's and market breadth's indicate for traders?
-
How significant is the oversold level in predicting a market rebound, and what thresholds should investors watch for?
-
The 2 scenarios you need to prepare for and my current bias based on 2 reasons.
-
And a lot more...
Market environment
The bullish vs. bearish setup is 226 to 278 from the screenshot of my stock screener below.
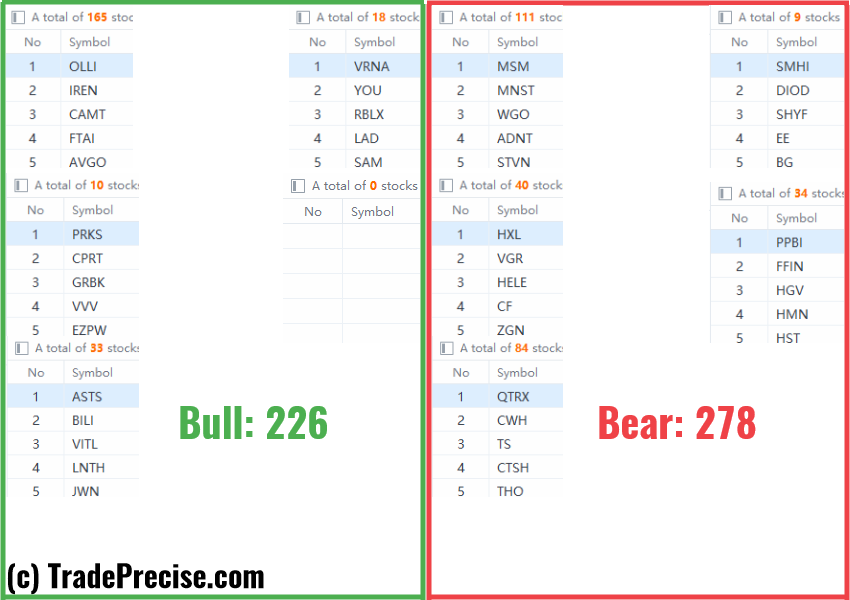
Although the market breadth has been decreasing, the number of bullish setups is still above 200. There is no shortage of the long setups.
However, the main focus should be on the technology stocks as this is the only sector RSPT beating the S&P 500.
Three stocks ready to soar
10 “low-hanging fruits” APH, CAVA, QCOM trade entries setups + 17 actionable setups were discussed during the live session before the market open (BMO).
The trade setup in DELL and MU discussed in the past session has been working well, which further confirms the outperformance in the technology sector (apart from NVDA alone).
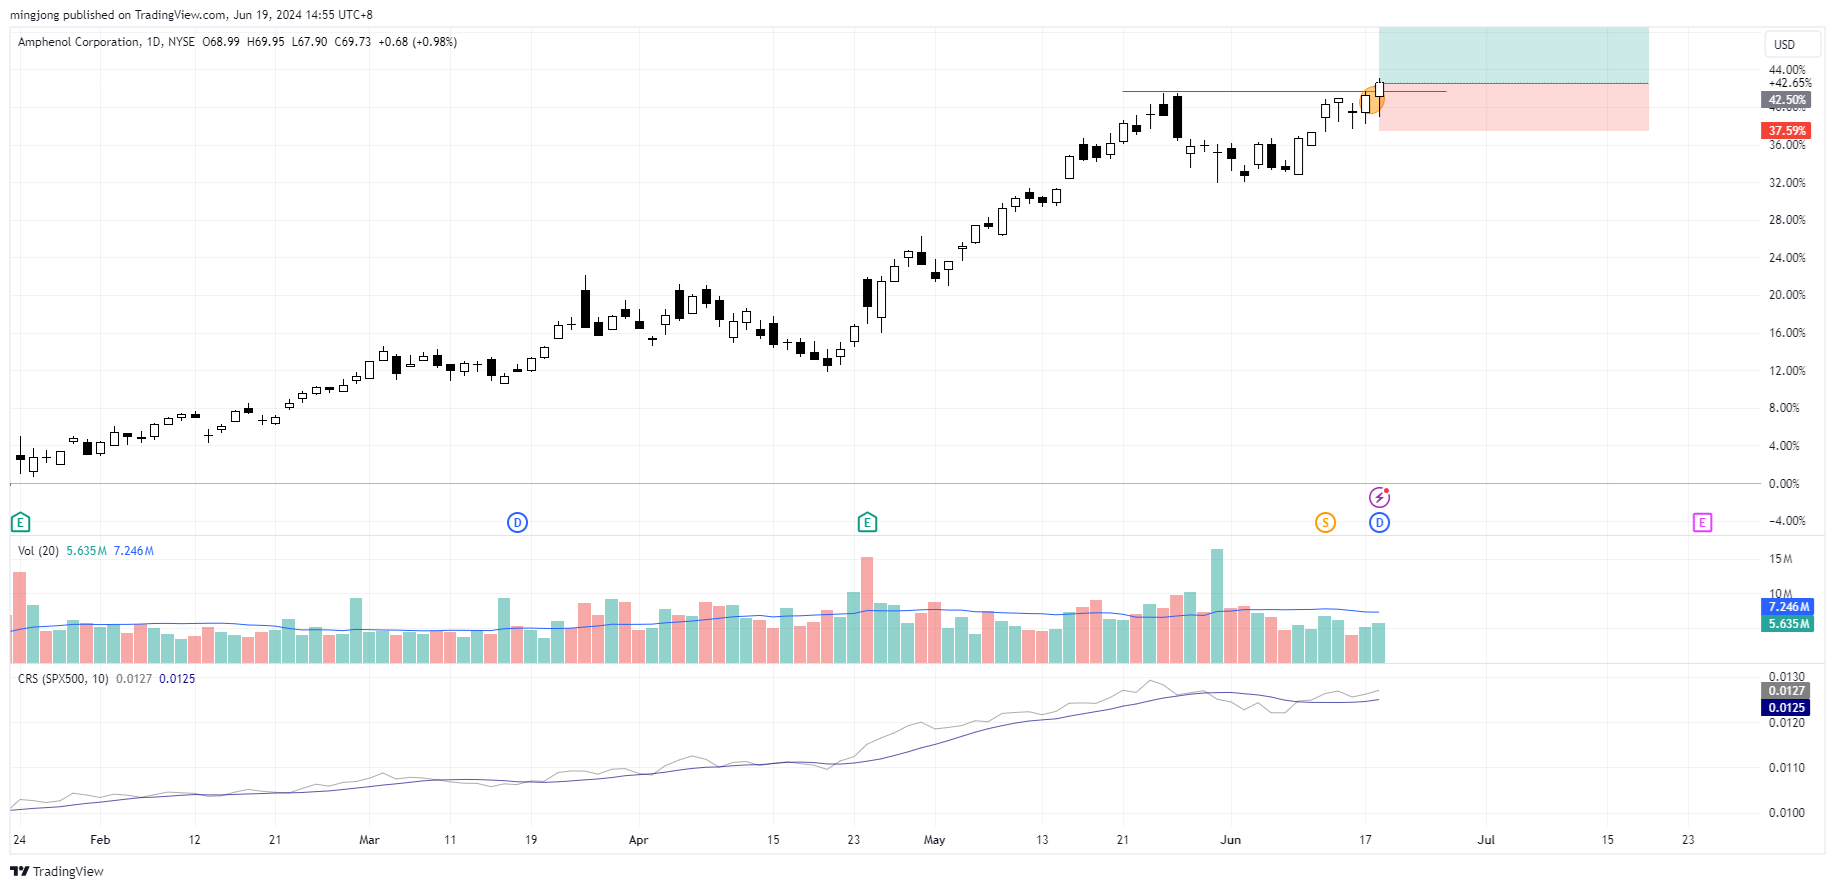
APH
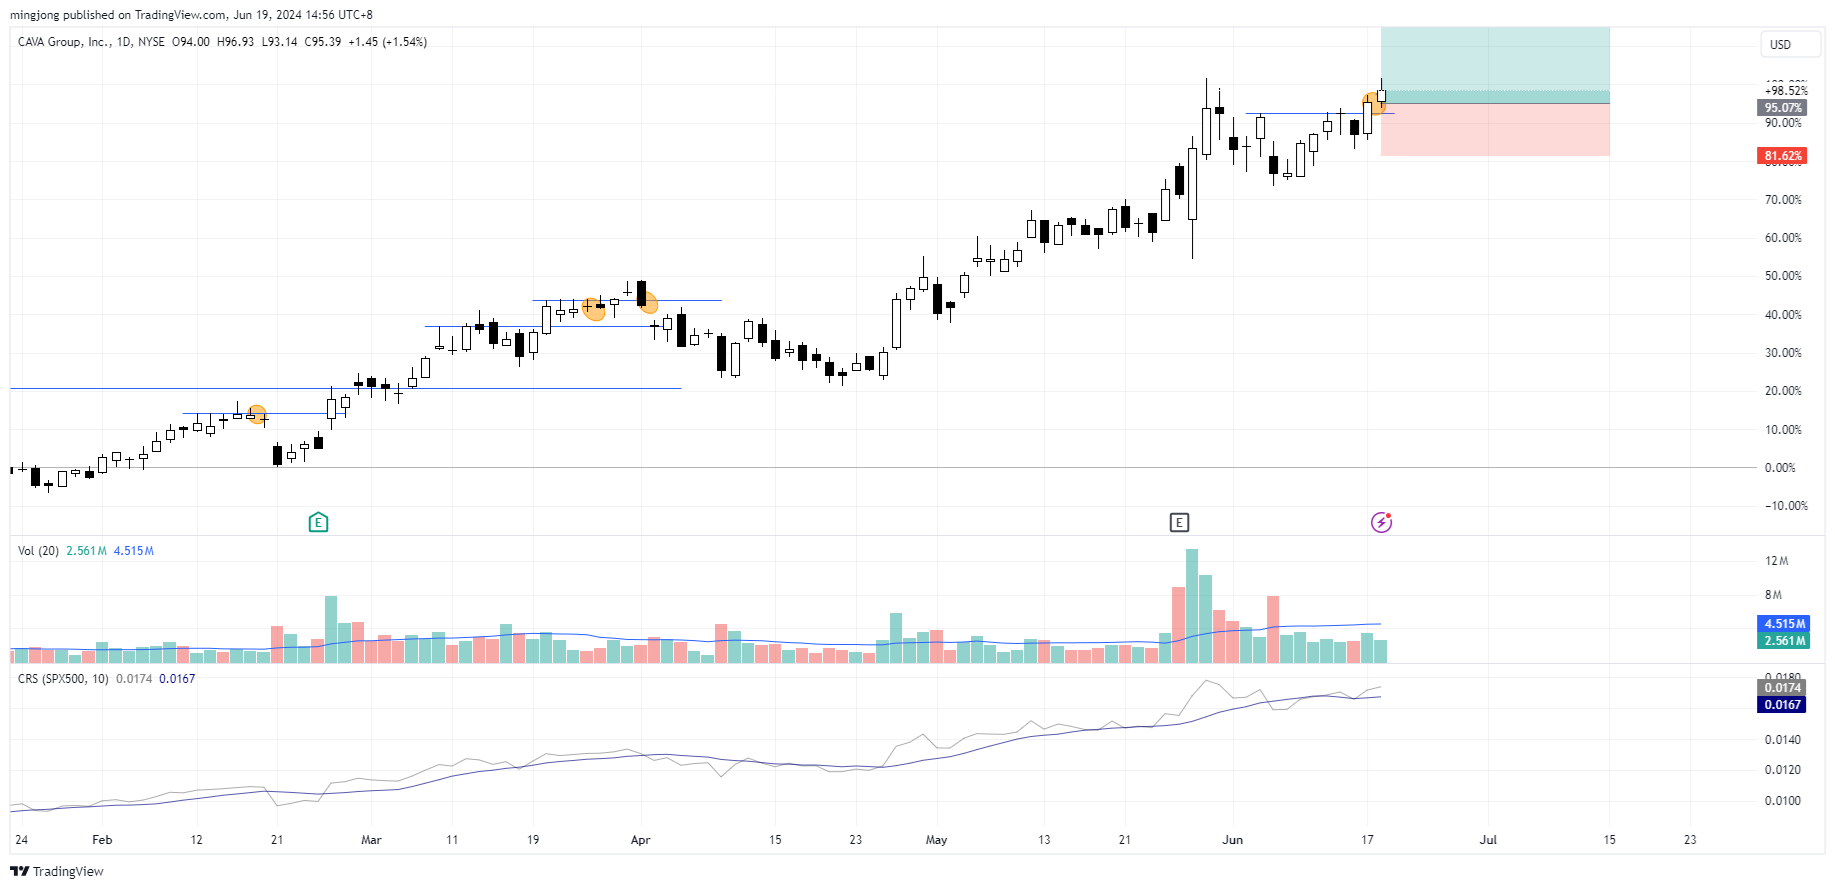
CAVA
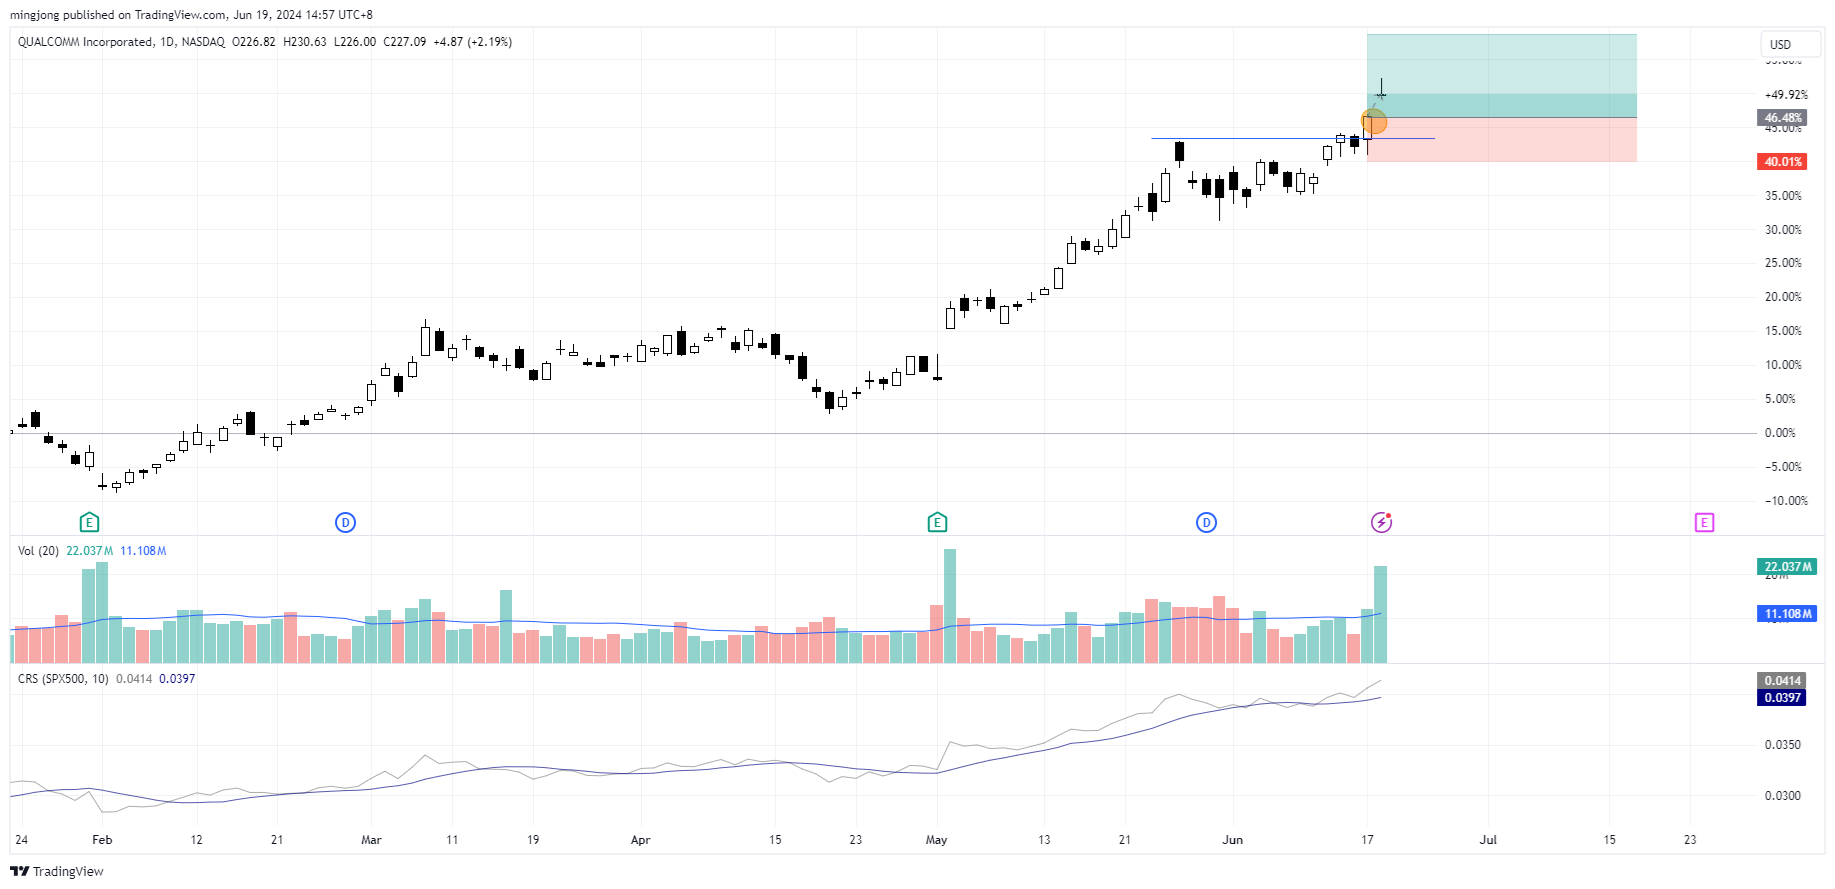
QCOM
Author

Ming Jong Tey
Independent Analyst
Ming Jong Tey has been trading since 2008. He started his learning journey from technical analysis (indicators, Fibonacci, etc...) to value investing. Throughout his journey, he develops an interest in price action with chart pattern trading.


