Mahindra and Mahindra Elliott Wave technical analysis [Video]
![Mahindra and Mahindra Elliott Wave technical analysis [Video]](https://editorial.fxstreet.com/images/TechnicalAnalysis/ChartPatterns/Chartism/stock-market-ticker-board-black-17803444_XtraLarge.jpg)
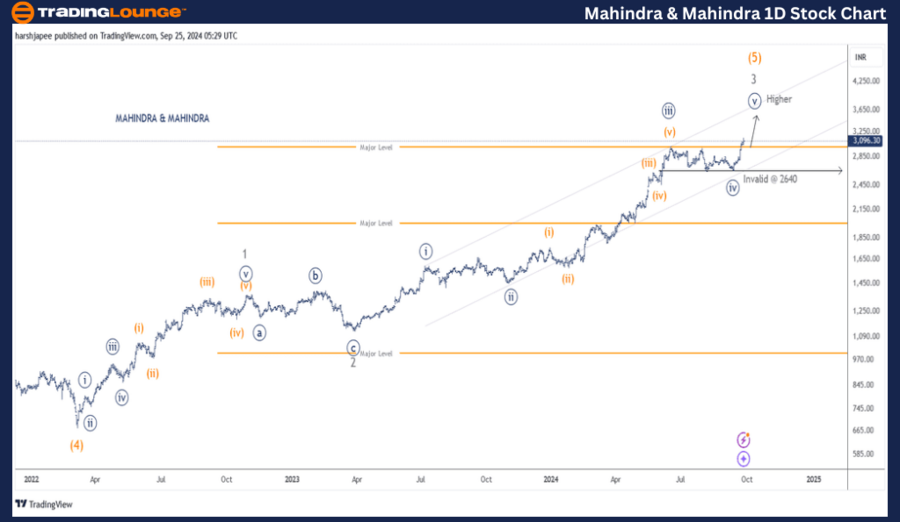
Mahindra & Mahindra (one-day chart) Elliott Wave technical analysis
Function: Larger Degree Trend Higher (Intermediate degree, Wave (5) Orange).
Mode: Motive.
Structure: Impulse.
Position: Minute Wave ((v)) Navy.
Details: Minute Wave ((v)) Navy is progressing higher within Minor Wave 3 Grey of Intermediate Wave (5) Orange against 2640. Risk tightened.
Invalidation point: 2640.
MAHINDRA & MAHINDRA daily chart technical analysis and potential Elliott Wave counts:
MAHINDRA & MAHINDRA daily chart indicates a progressive trend higher towards 3300-3400 range in the near term as Minute Wave ((v)) unfolds within Minor Wave 3 Grey of Intermediate Wave (5) Orange. Immediate support and risk is at 2640 mark.
The stock has been progressing higher since March 2022 lows around 670-75 range; Intermediate Wave (4) Orange termination. Minor Wave 1 Grey terminated around 1370, followed by an expanded flat Minor Wave 2 Grey around 1120 mark.
Minor Wave 3 Grey has been extended and is within its last leg higher; Minute Wave ((v)) towards 3200-3300 range at least. Risk has been tightened to 2640 now as a break lower would suggest Wave 3 top is in place.
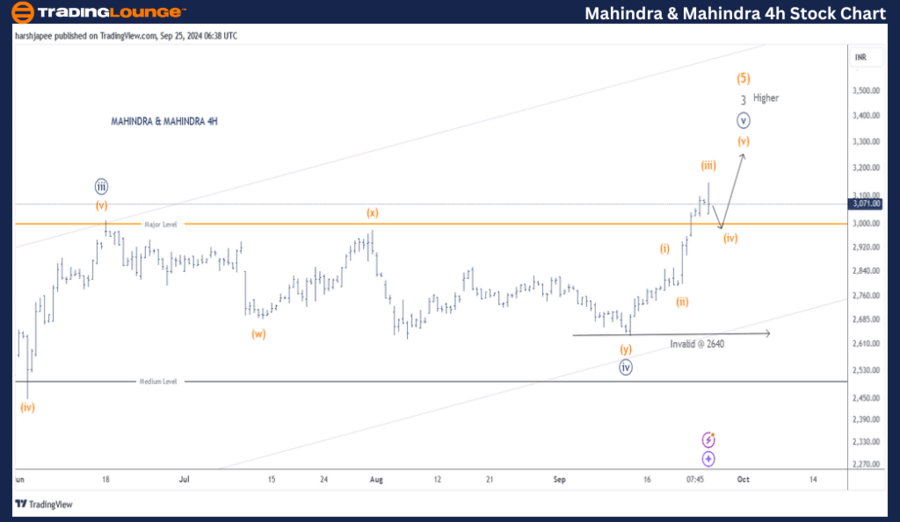
Mahindra & Mahindra Elliott Wave technical analysis
Function: Larger Degree Trend Higher (Intermediate degree, Wave (5) Orange).
Mode: Motive.
Structure: Impulse.
Position: Minute Wave ((v)) Navy.
Details: Minute Wave ((v)) Navy is progressing higher within Minor Wave 3 Grey of Intermediate Wave (5) Orange against 2640. Further, Minuette Wave (iii) Orange might be complete around 3150. If correct, Minuette Wave (iv) might drag a bit lower before the rally resumes.
Invalidation point: 2640.
Mahindra & Mahindra four-hour chart technical analysis and potential Elliott Wave counts:
MAHINDRA & MAHINDRA 4H chart highlights the sub waves since Minute Wave ((iii)) top around 3000 mark. Please note Wave ((iv)) unfolded as a combination before terminating around 2640 mark. Since then, Minute Wave ((v)) is unfolding potentially towards 3300 mark.
Conclusion
Mahindra & Mahindra is progressing higher towards 3200-3300 range as Minute Wave ((v)) unfolds within Minor Wave 3 Grey of Intermediate Wave (5) Orange.
Mahindra & Mahindra Elliott Wave technical analysis [Video]
Author

Peter Mathers
TradingLounge
Peter Mathers started actively trading in 1982. He began his career at Hoei and Shoin, a Japanese futures trading company.


