![]() Elliott Wave Forecast Team
Elliott Wave Forecast Team
ElliottWave-Forecast.com
The Elliott Wave Theory’s main pattern has a five-waves advance and three-waves pullback. The Theory explains that the market moves in sequences of five waves starting from the lower Subminutte to the higher Grand Super Cycle degree. Long-time investors look for higher degrees of correction to enter the Market. The higher degrees provide higher risk but also higher degree return.
Elliott Wave theory’s main pattern
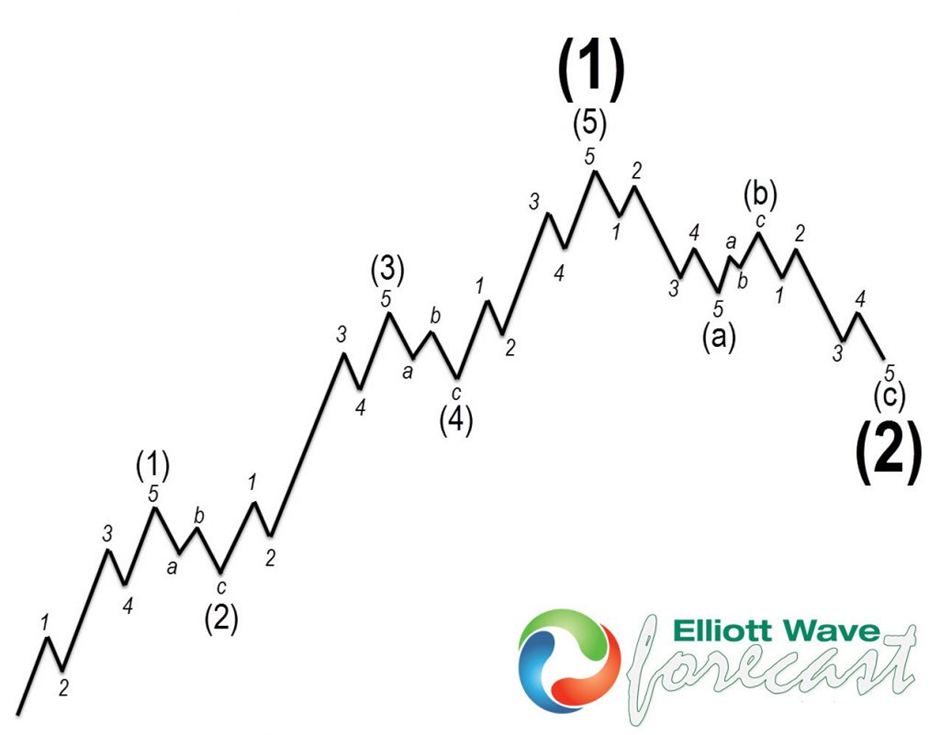
The graph above shows the main Elliott Wave’s Pattern. As we explained before, it shows the five waves’ advance and the three waves’ pullback. The Market will always trade in the direction of the previous five waves after the Zig Zag correction ends. Southwest Airlines (ticker symbol: LUV) shows a clear five-waves advance within the Grand Super Cycle which ended on 10.01.2017. Since then, it is in a correction with a structure of five-three-five. This structure is what the Theory calls a zigzag or ABC. It is a clear corrective structure because it is straightforward. We believe the market has changed and high frequency machine often indicates the 100%-161.8% area to provide a unique opportunity to enter the market in the direction of the right side.
Weekly Southwest Airlines (LUV) Elliott Wave chart
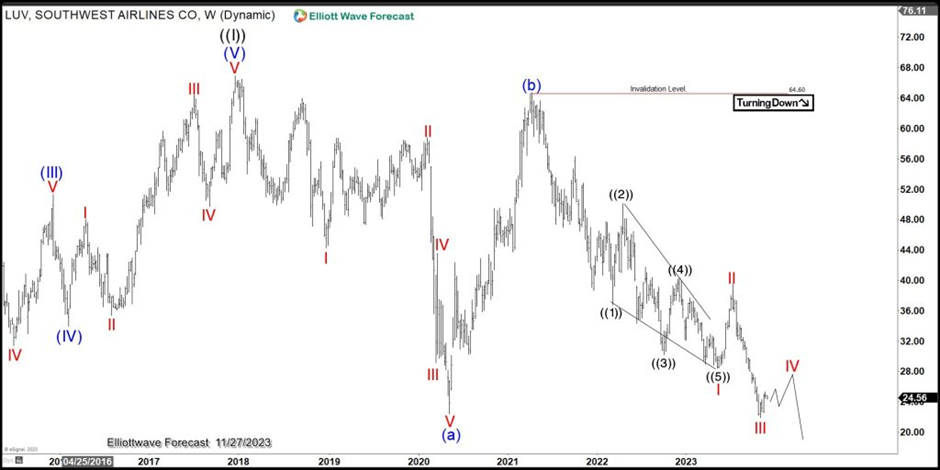
The weekly Elliott Wave chart above shows the structure of a simple ABC correction. The move started from the peak on 10.01.2017, and the C wave started on 04.01.2021.
Monthly Southwest Airlines Elliott Wave chart
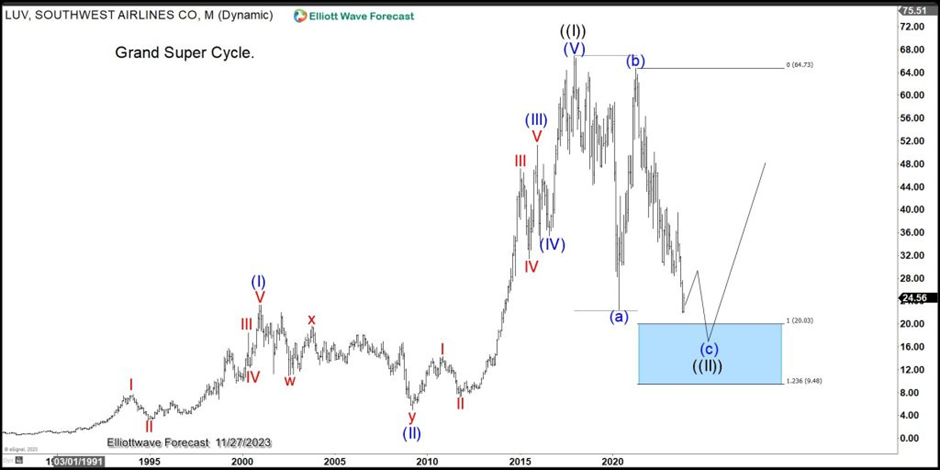
The monthly Elliott Wave Chart of LUV above shows the Grand Super Cycle for the company. It suggests the technical three waves (ABC) pullback to the Blue Box area. As we explained earlier, the right side (trend) is higher because of the five waves advance. The buyers are in complete control when the market’s impulse runs in a sequence of 5-9-13-17-21. The ABC within the correction should be trading at wave ((4)) of wave (c) lower at this point before the stock reaches the buying area.
In corrective structure, the market moves in 3-7-11. Once the correction ends, the chances of new highs from the blue box area are pretty high. Long-time investors should enter the market at the Blue Box area and let the market decide. A reaction should happen regardless. Even if the trade can take years to reach the target, the return is worth the wait.
Southwest Airlines (LUV) Elliott Wave video
FURTHER DISCLOSURES AND DISCLAIMER CONCERNING RISK, RESPONSIBILITY AND LIABILITY Trading in the Foreign Exchange market is a challenging opportunity where above average returns are available for educated and experienced investors who are willing to take above average risk. However, before deciding to participate in Foreign Exchange (FX) trading, you should carefully consider your investment objectives, level of xperience and risk appetite. Do not invest or trade capital you cannot afford to lose. EME PROCESSING AND CONSULTING, LLC, THEIR REPRESENTATIVES, AND ANYONE WORKING FOR OR WITHIN WWW.ELLIOTTWAVE- FORECAST.COM is not responsible for any loss from any form of distributed advice, signal, analysis, or content. Again, we fully DISCLOSE to the Subscriber base that the Service as a whole, the individual Parties, Representatives, or owners shall not be liable to any and all Subscribers for any losses or damages as a result of any action taken by the Subscriber from any trade idea or signal posted on the website(s) distributed through any form of social-media, email, the website, and/or any other electronic, written, verbal, or future form of communication . All analysis, trading signals, trading recommendations, all charts, communicated interpretations of the wave counts, and all content from any media form produced by www.Elliottwave-forecast.com and/or the Representatives are solely the opinions and best efforts of the respective author(s). In general Forex instruments are highly leveraged, and traders can lose some or all of their initial margin funds. All content provided by www.Elliottwave-forecast.com is expressed in good faith and is intended to help Subscribers succeed in the marketplace, but it is never guaranteed. There is no “holy grail” to trading or forecasting the market and we are wrong sometimes like everyone else. Please understand and accept the risk involved when making any trading and/or investment decision. UNDERSTAND that all the content we provide is protected through copyright of EME PROCESSING AND CONSULTING, LLC. It is illegal to disseminate in any form of communication any part or all of our proprietary information without specific authorization. UNDERSTAND that you also agree to not allow persons that are not PAID SUBSCRIBERS to view any of the content not released publicly. IF YOU ARE FOUND TO BE IN VIOLATION OF THESE RESTRICTIONS you or your firm (as the Subscriber) will be charged fully with no discount for one year subscription to our Premium Plus Plan at $1,799.88 for EACH person or firm who received any of our content illegally through the respected intermediary’s (Subscriber in violation of terms) channel(s) of communication.


Recommended content
Editors’ Picks

AUD/USD retakes 0.6000 on the road to recovery amid US-China trade war
AUD/USD is off the five-year low but remains heavy near 0.6000 in the Asian session on Monday. The pair continues to suffer from a US-China trade war as US President Trump said that he would not do a deal with China until the US trade deficit was sorted out.

USD/JPY attempts tepid recovery above 146.00
USD/JPY kicks off the new week on a weaker note, though it manages to stage a tepid recovery above 146.00 early Monday. The global carnage, amid the mounting risk of a recession and a trade war led by Trump's sweeping tariffs, keeps the safe-haven Japanese Yen underpinned at the expense of the US Dollar.

Gold holds the bounce above $3,000 amid Asia risk-off profile
Gold price recovers ground above $3,000 in the Asian session on Monday. The global market turmoil extends and hence, Gold buyers manage to find their feet as trade war and recession risks escalate and revive the haven demand for the yellow metal after Friday's 'sell everything' mode.

Bitcoin could be the winner in the ongoing trade war after showing signs of decoupling from stocks
Bitcoin traded above $84,000 on Friday, showing strength despite the stock market experiencing significant declines. The market reaction stems from United States President Donald Trump's clash with the Federal Reserve Chairman Jerome Powell over interest rate decisions.

Strategic implications of “Liberation Day”
Liberation Day in the United States came with extremely protectionist and inward-looking tariff policy aimed at just about all U.S. trading partners. In this report, we outline some of the more strategic implications of Liberation Day and developments we will be paying close attention to going forward.

The Best brokers to trade EUR/USD
SPONSORED Discover the top brokers for trading EUR/USD in 2025. Our list features brokers with competitive spreads, fast execution, and powerful platforms. Whether you're a beginner or an expert, find the right partner to navigate the dynamic Forex market.