LULU Elliott Wave technical analysis
Function: Trend.
Mode: Impulsive.
Structure: Motive.
Position: Wave (1).
Direction: Upside in (1).
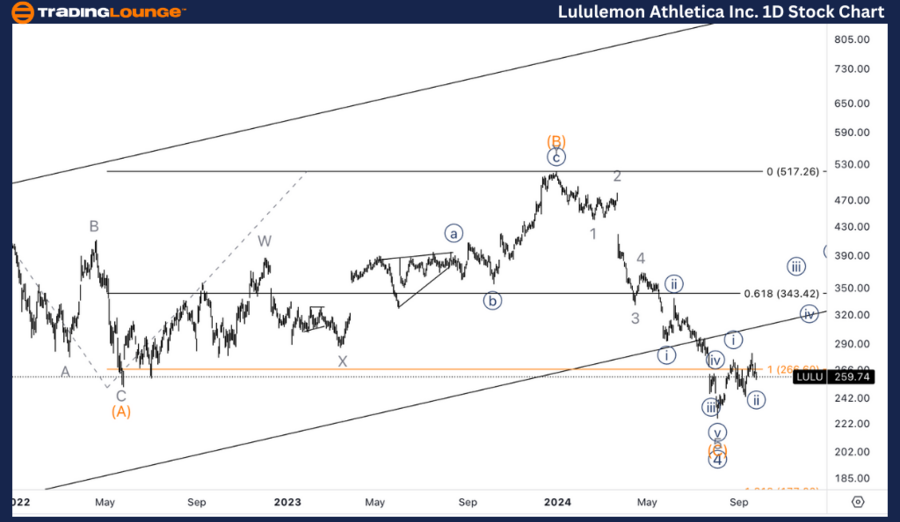
Details: We are looking at the possibility of a bottom in place in Primary wave 4, to now resume higher, as we found support on top of TL2 at 200$.
LULU Elliott Wave technical analysis – Daily chart
On the daily chart, Lululemon is progressing in Wave (1) of a new impulsive upward trend, following what appears to be the completion of Primary Wave 4. The stock has found support around $200, near Trading Level 2 (TL2), which indicates a likely bottom has formed.
With this support in place, the expectation is for a continuation of the upside as Wave (1) progresses, marking the beginning of a new bullish cycle. Traders can look for confirmation of this trend resumption as the price pushes higher above key resistance levels.
LULU Elliott Wave technical analysis
Function: Trend.
Mode: Impulsive.
Structure: Motive.
Position: Wave 1.
Direction: Bottom in wave {ii} of 1.
Details: Looking for the completion of a three wave move into wave {ii} to then resume higher. As the initial move down from the wave {i} top appears to be a three wave move, we could expect at least another leg higher.
LULU Elliott Wave technical analysis – One-hour chart
On the 1-hour chart, Lululemon is within Wave 1 of the larger daily structure, and we are currently observing a correction in Wave {ii}. The move down from the Wave {i} top appears to be a three - wave corrective structure, which suggests that Wave {ii} is nearing completion.
Once this correction ends, the expectation is for the stock to resume its upward trajectory, likely signaling the start of Wave {iii}. Given the corrective nature of the decline, the next leg higher could provide a strong bullish impulse.
.png.c3cfc3d46f5136249dec4a452a633134.png)
This Elliott Wave analysis for Lululemon Athletica Inc. (LULU) evaluates the current trend structure and provides insights into potential future movements based on wave positioning. We will examine both the daily and 1-hour charts to gauge the stock’s outlook.
Lululemon Athletica Inc. (LULU) Elliott Wave technical analysis [Video]
As with any investment opportunity there is a risk of making losses on investments that Trading Lounge expresses opinions on.
Historical results are no guarantee of future returns. Some investments are inherently riskier than others. At worst, you could lose your entire investment. TradingLounge™ uses a range of technical analysis tools, software and basic fundamental analysis as well as economic forecasts aimed at minimizing the potential for loss.
The advice we provide through our TradingLounge™ websites and our TradingLounge™ Membership has been prepared without considering your objectives, financial situation or needs. Reliance on such advice, information or data is at your own risk. The decision to trade and the method of trading is for you alone to decide. This information is of a general nature only, so you should, before acting upon any of the information or advice provided by us, consider the appropriateness of the advice considering your own objectives, financial situation or needs. Therefore, you should consult your financial advisor or accountant to determine whether trading in securities and derivatives products is appropriate for you considering your financial circumstances.
Recommended content
Editors’ Picks
EUR/USD extends recovery beyond 1.0400 amid Wall Street's turnaround
EUR/USD extends its recovery beyond 1.0400, helped by the better performance of Wall Street and softer-than-anticipated United States PCE inflation. Profit-taking ahead of the winter holidays also takes its toll.

GBP/USD nears 1.2600 on renewed USD weakness
GBP/USD extends its rebound from multi-month lows and approaches 1.2600. The US Dollar stays on the back foot after softer-than-expected PCE inflation data, helping the pair edge higher. Nevertheless, GBP/USD remains on track to end the week in negative territory.

Gold rises above $2,620 as US yields edge lower
Gold extends its daily rebound and trades above $2,620 on Friday. The benchmark 10-year US Treasury bond yield declines toward 4.5% following the PCE inflation data for November, helping XAU/USD stretch higher in the American session.

Bitcoin crashes to $96,000, altcoins bleed: Top trades for sidelined buyers
Bitcoin (BTC) slipped under the $100,000 milestone and touched the $96,000 level briefly on Friday, a sharp decline that has also hit hard prices of other altcoins and particularly meme coins.
Bank of England stays on hold, but a dovish front is building
Bank of England rates were maintained at 4.75% today, in line with expectations. However, the 6-3 vote split sent a moderately dovish signal to markets, prompting some dovish repricing and a weaker pound. We remain more dovish than market pricing for 2025.

Best Forex Brokers with Low Spreads
VERIFIED Low spreads are crucial for reducing trading costs. Explore top Forex brokers offering competitive spreads and high leverage. Compare options for EUR/USD, GBP/USD, USD/JPY, and Gold.