Low volume flag breakout, what’s next for SP 500? [Video]
![Low volume flag breakout, what’s next for SP 500? [Video]](https://editorial.fxstreet.com/images/Markets/Equities/SP500/wall_street_nyse2-637299021353183737_XtraLarge.jpg)
Watch the free-preview video below extracted from the WLGC session before the market opens on 9 Jul 2024 to find out the following:
-
Short-term and long-term support and resistance levels to watch in the S&P 500.
-
How to interpret the low volume during a flag breakout.
-
The potential target price for the S&P 500
-
How to identify selling into strength in the uptrend.
-
And a lot more…
Market environment
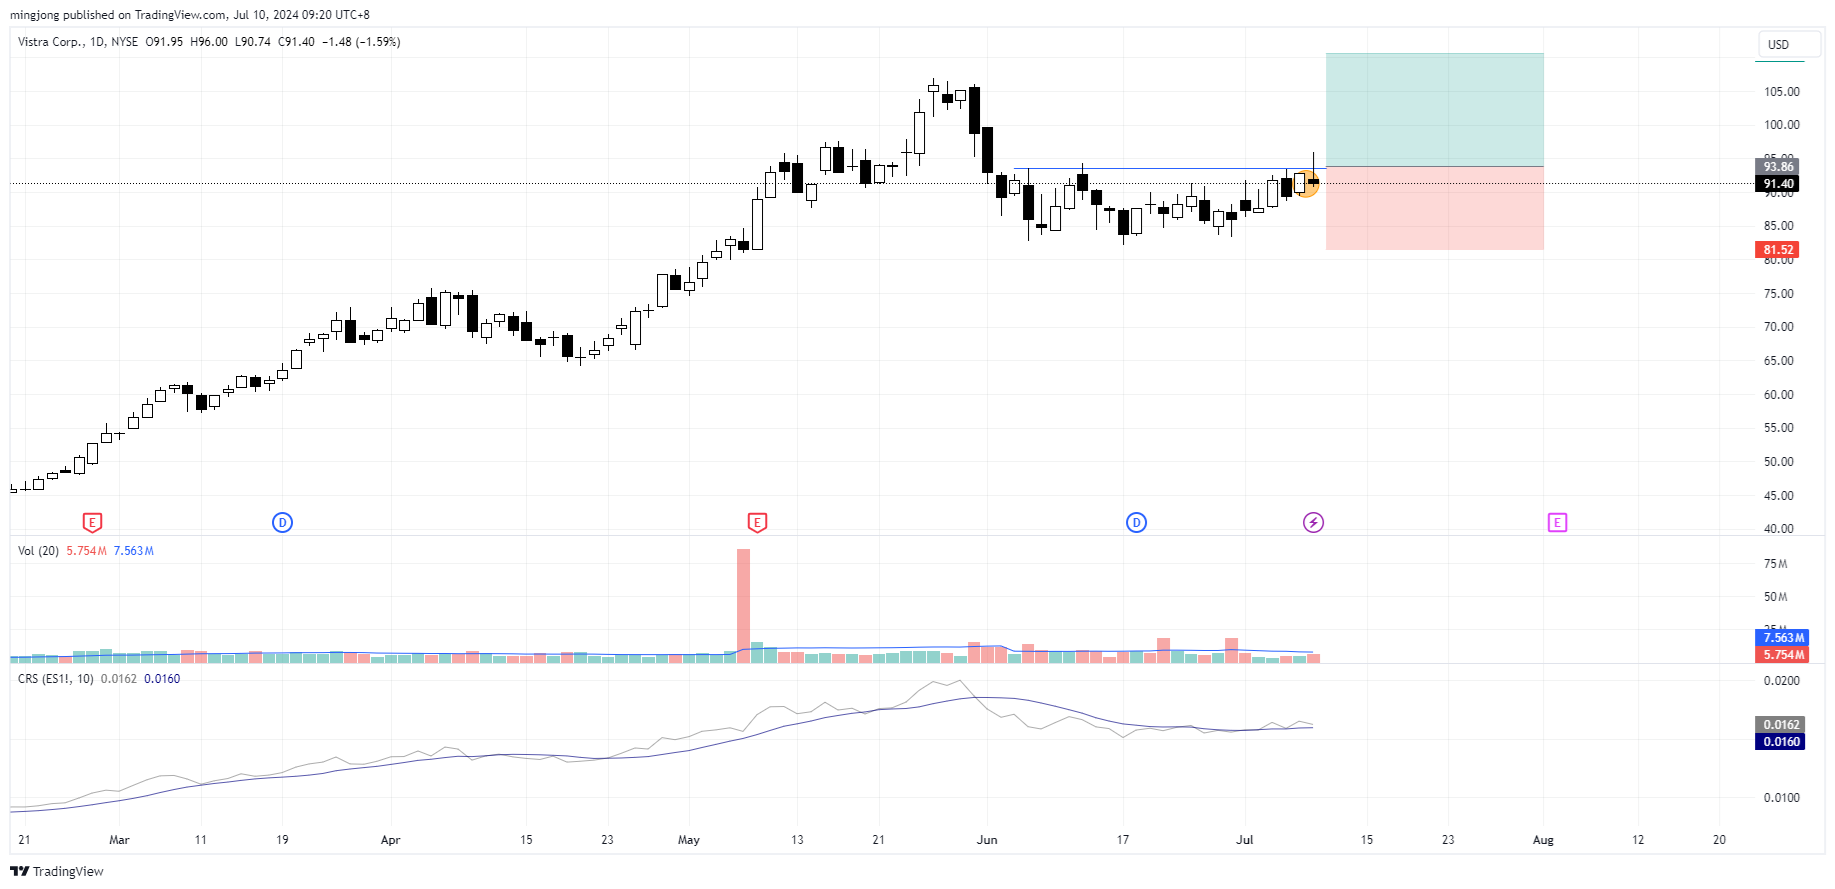
The bullish vs. bearish setup is 376 to 195 from the screenshot of my stock screener below.
The market environment has been improving slightly.
However, the short-term market breadth is still consolidating and only a handful of the setups showing strong momentum.
Three stocks ready to soar
10 “low-hanging fruits” trade entries setups VST, TJX + 25 actionable setups CRUS were discussed during the live session before the market open (BMO).
VST
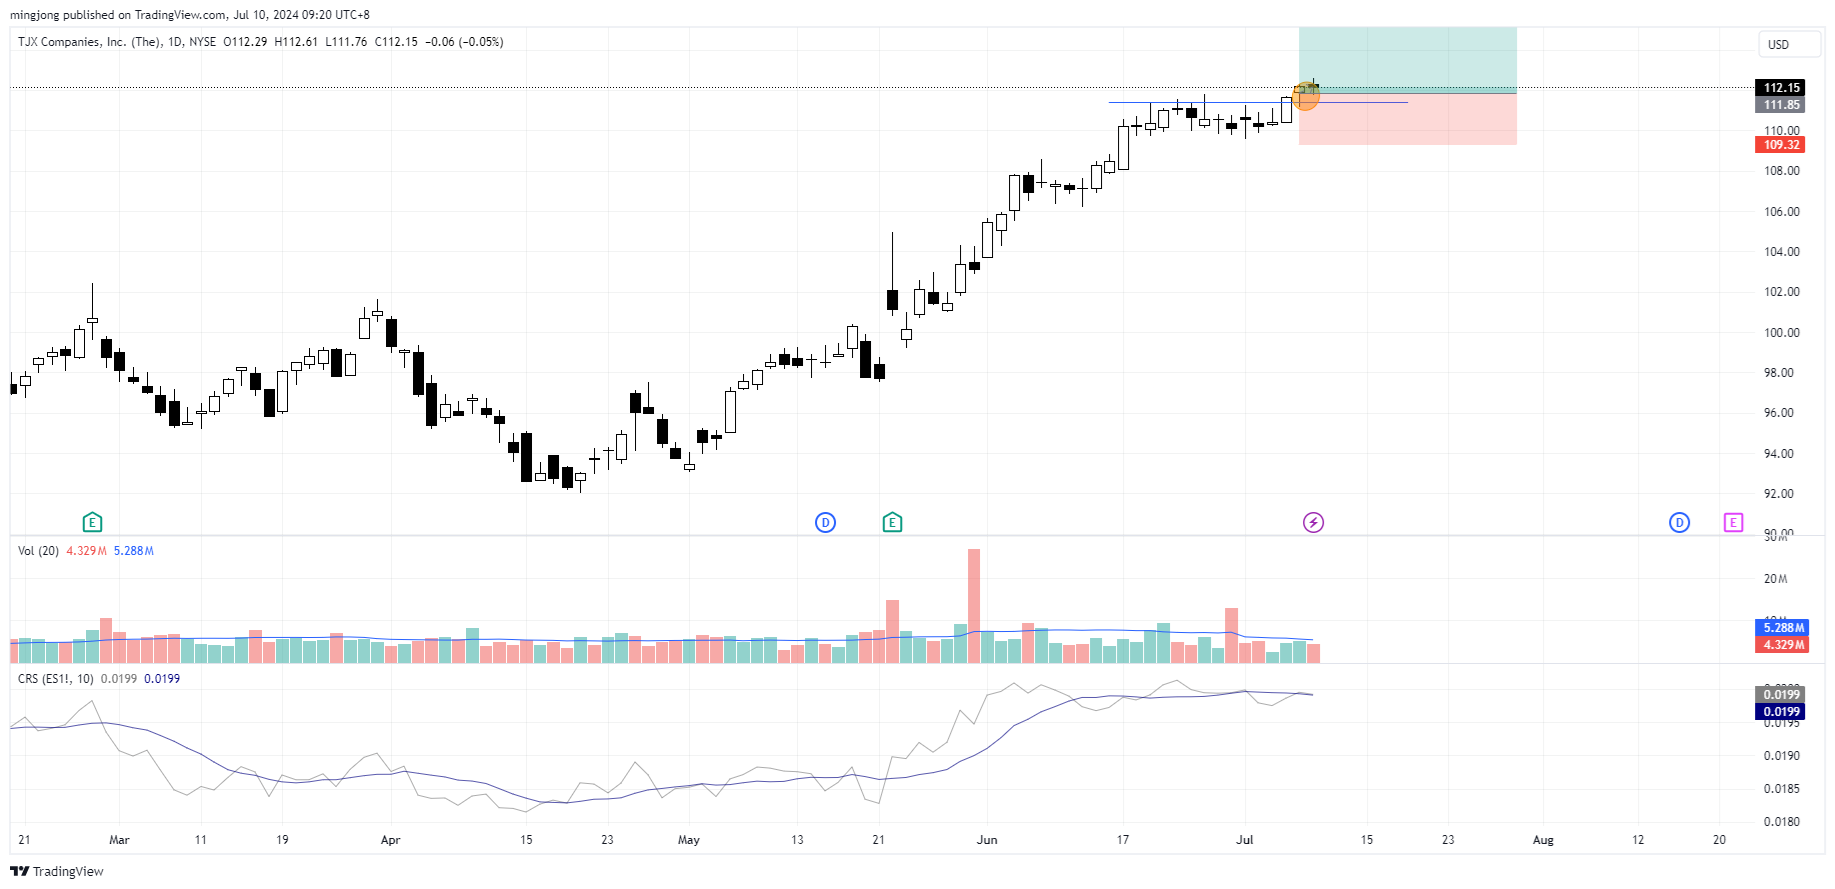
TJX
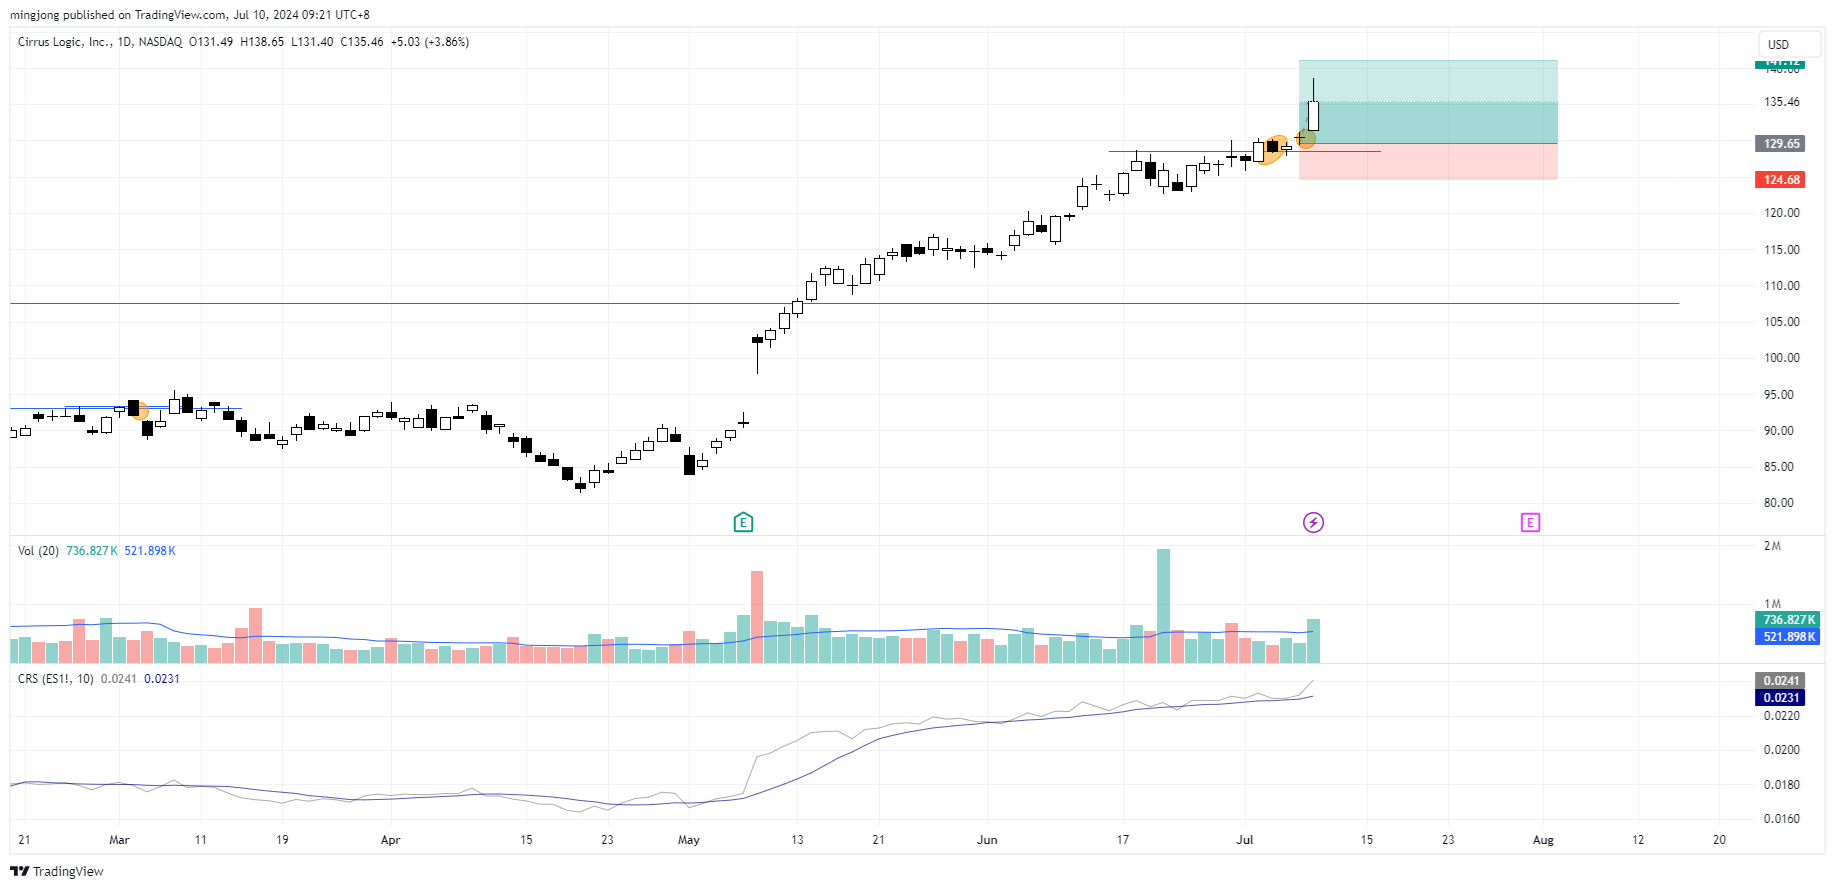
CRUS
Author

Ming Jong Tey
Independent Analyst
Ming Jong Tey has been trading since 2008. He started his learning journey from technical analysis (indicators, Fibonacci, etc...) to value investing. Throughout his journey, he develops an interest in price action with chart pattern trading.


