Long term outlook of SP 500 (SPX) nesting higher [Video]
![Long term outlook of SP 500 (SPX) nesting higher [Video]](https://editorial.fxstreet.com/images/Markets/Equities/SP500/wall_street_nyse2-637299021353183737_XtraLarge.jpg)
On March 4, 1957, the Standard & Poor’s 500 < SPX> was introduced. The S&P 500 index has became synonymous with the term “U.S. stock market.” It is one of the leading benchmarks for the market, even though others, including the Russell and Wilshire indexes, are broader measures of the market. In this video, we are going to take a deep look at the long term Elliott Wave count for the Index. We will explain why it’s possible for S&P 500 to reach 10,000 in the next few years. Since 2009 crash of the Indices, most traders have been bearish the Indices. Even until now, we continue to hear from many traders how Indices are overbought and will crash.
We at EWF have been a proponent of the Indices and we have consistently called for bullish move throughout the years. In a similar way, when many people today think Indices are overbought and will crash again, we call for even more upside based on our analysis. Below is the popular view of S&P 500 within wave (V)
SP 500 (SPX) five waves within grand super cycle
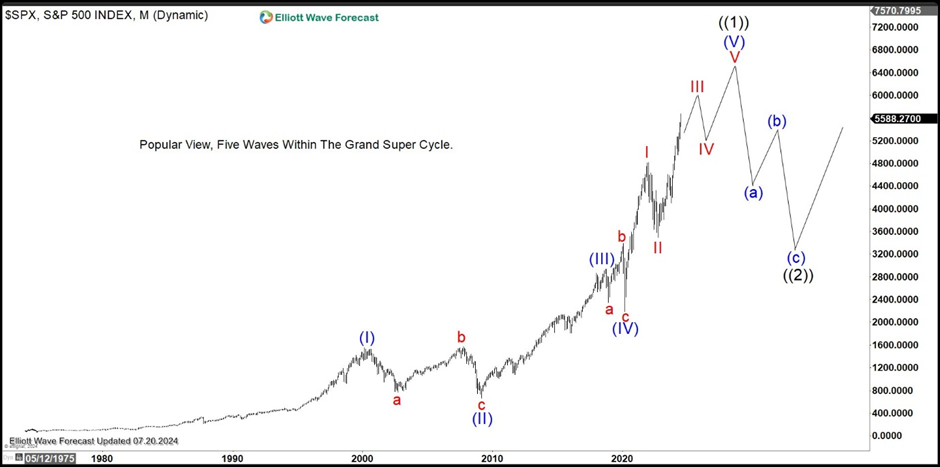
In this popular view, S&P 500 is currently in wave (V) Super Cycle degree from the all-time low. However, even if it is going to end wave (V), the Index still needs another leg higher to complete 5 waves up from 2020. Elliott Wave was developed in 1930 based on several rules. However, at that time, there’s still no other tool. Over the years, we have implemented new tools such as the momentum indicator which includes RSI and Stochastic RSI. As the last wave, wave (V) often lacks momentum and thus shows momentum divergency in RSI. Furthermore, the Stochastic RSI in wave (IV) needs to fully reset. However, in the case of S&P 500, when looking at the yearly and quarterly chart, you will find the stochastic RSI does not reset and still sits at the high. This is in fact typical of a wave (III), not a wave (V). Thus, we believe that S&P 500 is not in wave (V), but rather in wave (III).
SP 500 as multiple nests
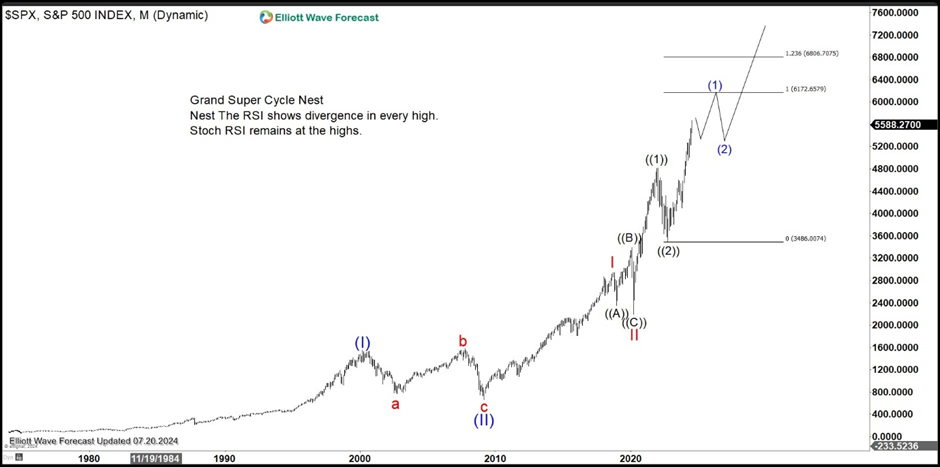
The chart above shows the Index is nesting higher as impulse structure. In yearly time frame, the high in 2021 in fact has erased the divergence in previous years. This suggests that the Index shouldn’t be in wave (V). Thus the Index is currently still in a wave ((3)) of III of (III). In other words, the Index shows a quadruple nest. This suggests the Index should continue to rally higher in the next few years and easily reach 10,000 within the next few years. We explain more about this idea in the video below
SP 500 (SPX) Elliott Wave video
Author

Elliott Wave Forecast Team
ElliottWave-Forecast.com


