Larsen & Toubro Elliott Wave technical analysis [Video]
![Larsen & Toubro Elliott Wave technical analysis [Video]](https://editorial.fxstreet.com/images/TechnicalAnalysis/ChartPatterns/Chartism/financial-graph-19311174_XtraLarge.jpg)
Larsen & Toubro Elliott Wave technical analysis
Function: Counter Trend (Intermediate degree, orange).
Mode: Corrective.
Structure: Impulse, within larger degree Wave (A).
Position: Minor Wave 3 Grey.
Details: Minor Wave 3 Grey is now progressing lower against 3930.
Invalidation point: 3930.
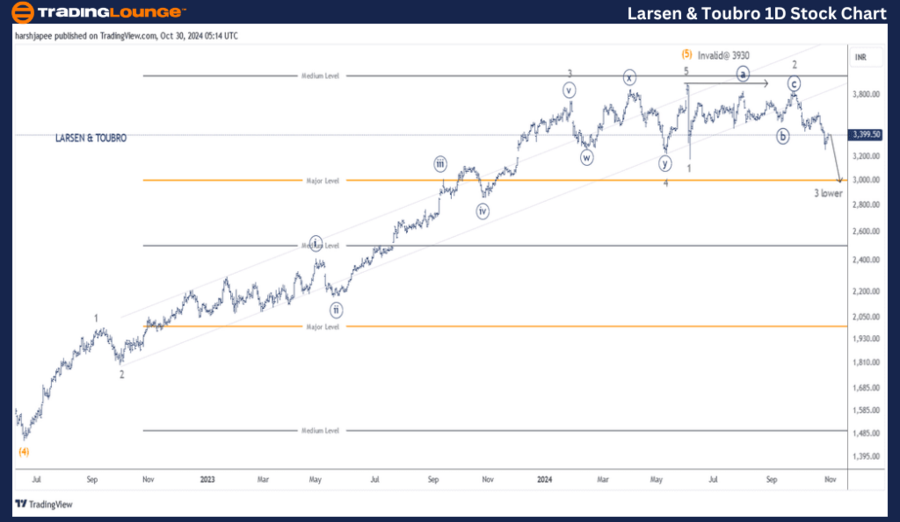
Larsen & Toubro daily chart technical analysis and potential Elliott Wave counts:
Larsen & Toubro daily chart is indicative of a potential counter trend in progress at Minor degree at least, against 3930 high. Intermediate Wave (5) Orange seems to have terminated around 3930 to complete the multiyear rally.
The stock had dropped to 1450 levels in June 2022, which is marked as Intermediate (5) Orange, on the daily chart. Bulls religiously remained in control and produced an impulse to terminate Intermediate Wave (5) Orange around 3930 mark on June 03, 2024.
Further, prices turned lower from there, dropping through 3180 levels marked as Minor Wave 1 of the larger degree corrective wave. Minor Wave 2 rallied through 3840 and prices turned lower since. A break below 3180-90 mark would accelerate lower.
LT Elliott Wave technical analysis
Function: Counter Trend (Intermediate degree, orange).
Mode: Corrective.
Structure: Impulse, within larger degree Wave (A).
Position: Minor Wave 3 Grey.
Details: Minor Wave 3 Grey is now progressing lower against 3930. Ideally, the stock should stay below 3840, Minor Wave 2 termination.
Invalidation point: 3930.
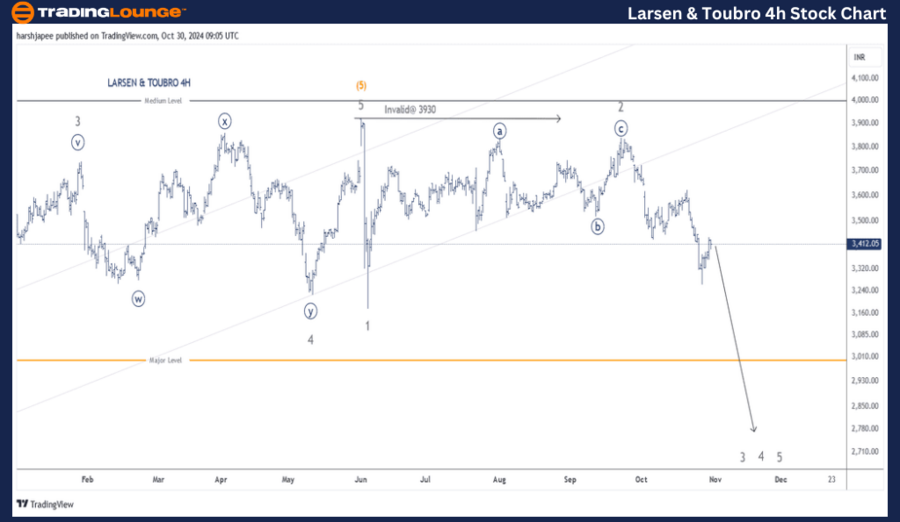
Larsen & Toubro four-hour chart technical analysis and potential Elliott Wave counts:
Larsen & Toubro 4H chart highlights the sub waves between Minor Wave 3 Grey, which terminated around 3750 mark during the rally and now. Minor Wave 4 Grey was a combination, while Minor Wave 5 was shallow, which terminated around 3930 mark. Since then, a larger degree corrective wave might be unfolding, which has Minor Wave 1 and 2 around 3200 and 3840 levels respectively. Minor Wave 3 is now progressing lower.
Conclusion
Larsen & Toubro is progressing lower within Minor Wave 3 Grey against 3930 high.
Larsen & Toubro Elliott Wave technical analysis [Video]
Author

Peter Mathers
TradingLounge
Peter Mathers started actively trading in 1982. He began his career at Hoei and Shoin, a Japanese futures trading company.