Kotak Mahindra Bank Elliott Wave technical analysis [Video]
![Kotak Mahindra Bank Elliott Wave technical analysis [Video]](https://editorial.fxstreet.com/images/Markets/Equities/Industries/Media/Netflix_2_XtraLarge.jpg)
Kotak Bank Elliott Wave technical analysis
Function: Larger Degree Trend Higher (Intermediate degree, orange).
Mode: Motive.
Structure: Impulse.
Position: Minute Wave ((ii)) Navy.
Details: Minute Wave ((iii)) is unfolding within Minor Wave 3 Grey of Intermediate Wave (5) Orange against 1602.
Invalidation point: 1602.
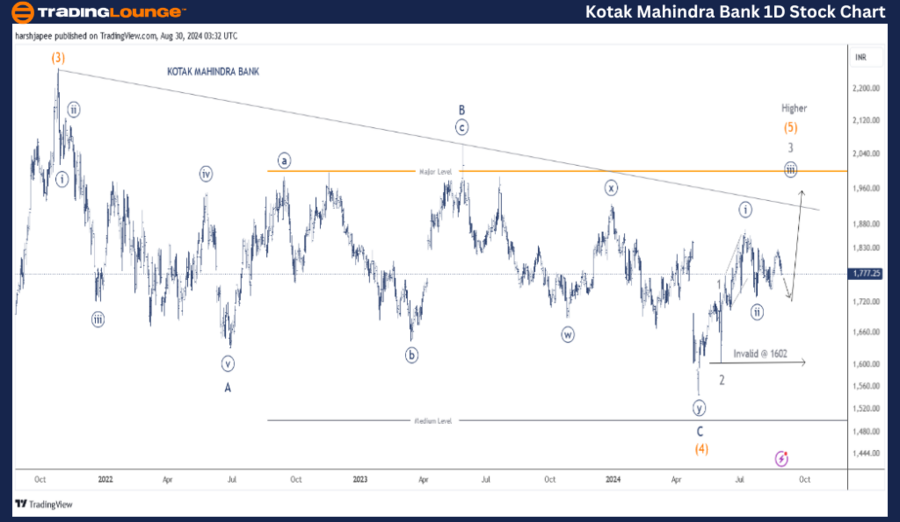
Kotak Mahindra Bank daily chart technical analysis and potential Elliott Wave counts:
Kotak Mahindra Bank daily chart is indicating a progressive trend higher and Minute Wave ((iii)) Navy could be underway soon towards 2100 while prices stay above 1600 broadly. The stock is drifting sideways for now and a break above 1830 should accelerate.
The bank stock has had a larger degree correction since October 2021 high registered around the 2250 mark. The Minor Wav A-B-C unfolded as a combination through 150 lows registered in May 2024. Also note Intermediate Wave (5) is underway now.
Kotak Mahindra Bank has lagged behind the overall Nifty 50 Index, which is at its all-times high but prices should soon accelerate as Minor Wave 3 could be unfolding with Intermediate Wave (5) Orange.
Kotak Bank Elliott Wave technical analysis
Function: Larger Degree Trend Higher (Intermediate degree, orange)
Mode: Motive
Structure: Impulse
Position: Minute Wave ((ii)) Navy
Details: Minute Wave ((iii)) is unfolding within Minor Wave 3 Grey of Intermediate Wave (5) Orange against 1602. Minute Wave ((ii)) might terminate as a triangle.
Invalidation point: 1602
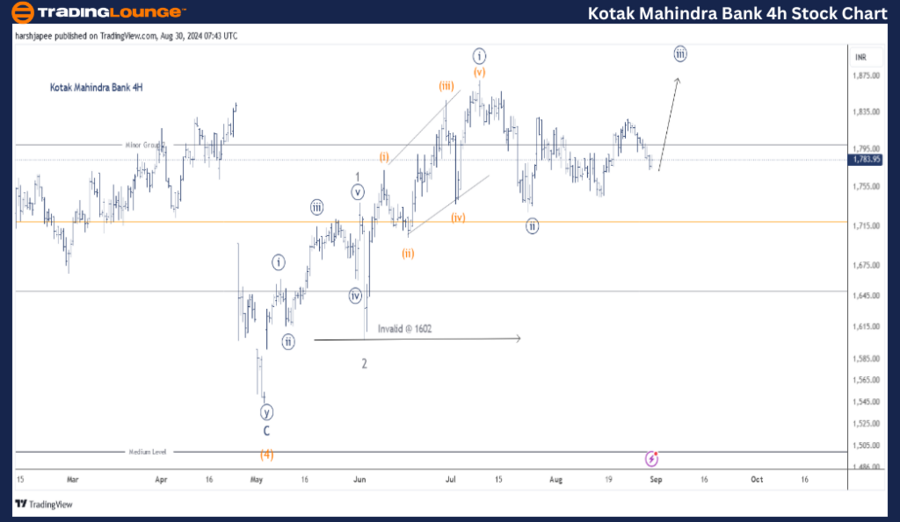
Kotak Mahindra Bank four-hour chart technical analysis and potential Elliott Wave counts:
The 4H chart gives a closer look on the sub waves since 1540 low carved in May 2024. Prices carved an impulse to terminate Minor Wave 1 Grey around 1735, followed by a sharp correction to unfold Minor Wave 2.
Minor Wave 3 could be sub diving as Minute Waves ((i)) and potential ((ii)) might be in place around 1865 and 1720 levels respectively. Also note that Minor Wave ((ii)) might unfold as a triangle before terminating.
Conclusion
Kotak Mahindra Bank is progressing higher within Minute Wave ((iii)) Navy of Minor Wave 3 Grey as Intermediate Wave (5) Orange unfolds. Invalidation is around 1602 for the bullish scenario.
Kotak Mahindra Bank Elliott Wave technical analysis [Video]
Author

Peter Mathers
TradingLounge
Peter Mathers started actively trading in 1982. He began his career at Hoei and Shoin, a Japanese futures trading company.


