KOSPI Composite Index Elliott Wave technical analysis [Video]
![KOSPI Composite Index Elliott Wave technical analysis [Video]](https://editorial.fxsstatic.com/images/i/Equity-Index_S&P500-2_XtraLarge.jpg)
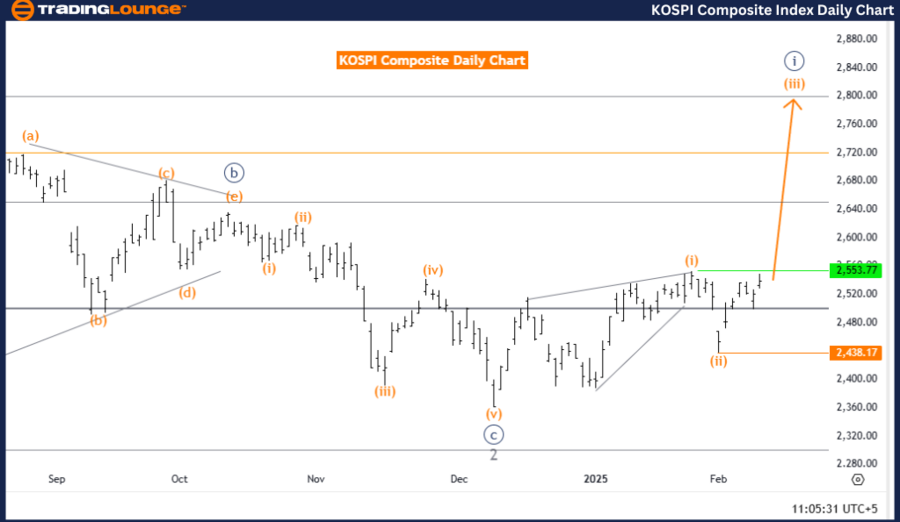
KOSPI Composite Elliott Wave Analysis – Trading Lounge Day Chart.
KOSPI Composite Elliott Wave technical analysis
-
Function: Bullish Trend.
-
Mode: Impulsive.
-
Structure: Orange wave 3.
-
Position: Navy Blue Wave 1.
-
Direction next higher degrees: Orange wave 3 (Started).
-
Details: Orange wave 2 appears to be completed, and now orange wave 3 is in progress.
-
Wave cancel invalidation level: 2,438.17.
KOSPI day chart analysis overview
The KOSPI Composite day chart reflects a bullish trend, based on Elliott Wave analysis, characterized by an impulsive wave structure. The market is currently within orange wave 3, signaling strong upward movement and increased market momentum. This phase is typically associated with a sustained rally in bullish market conditions.
At this stage, navy blue wave 1 is forming, indicating that the market is in the early stages of a broader uptrend. The completion of orange wave 2 marks the end of a corrective phase, allowing for the dynamic development of orange wave 3, which often carries strong momentum and favorable trading opportunities.
Bullish momentum and trading implications
With orange wave 3 gaining strength, traders should expect potential price advances during this phase. As a key part of an impulsive wave structure, this wave typically drives prices higher, making it an important focal point for market participants.
The analysis emphasizes the importance of monitoring price action throughout orange wave 3, as it offers opportunities for strategic trading decisions. The invalidation level is set at 2,438.17. If the price drops below this level, the current wave analysis would be invalid, necessitating a reevaluation of market conditions.
Conclusion
The KOSPI Composite day chart projects a bullish market outlook, with the primary focus on the impulsive growth of orange wave 3 within navy blue wave 1. The completion of orange wave 2 confirms a continuation of upward momentum, offering potential trading opportunities.
Traders should closely observe price action near the invalidation level (2,438.17) to maintain an accurate trading strategy and capitalize on bullish trends.
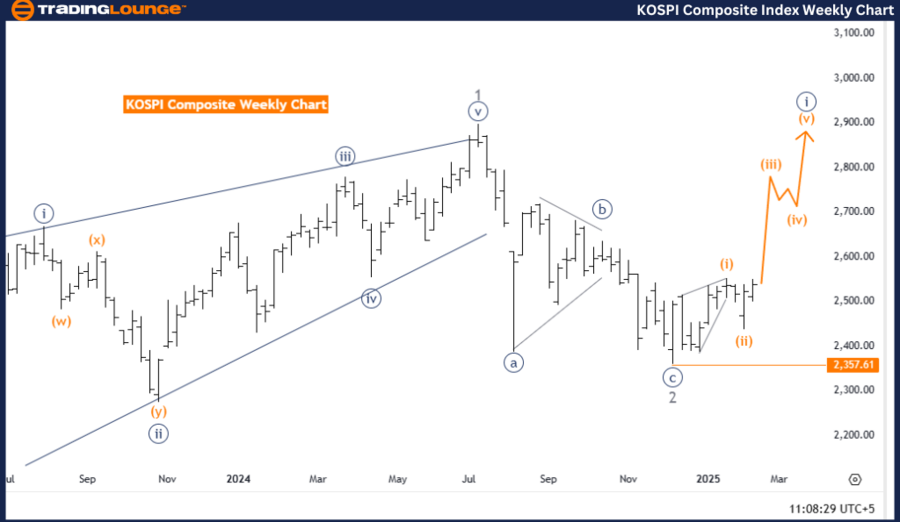
KOSPI Composite Elliott Wave Analysis – Trading Lounge Weekly Chart.
KOSPI Composite Elliott Wave technical analysis
-
Function: Bullish Trend.
-
Mode: Impulsive.
-
Structure: Orange wave 3.
-
Position: Navy Blue Wave 1.
-
Direction next higher degrees: Orange wave 3 (Started).
-
Details: Orange wave 2 appears to be completed, and now orange wave 3 is in progress.
-
Wave cancel invalidation level: 2,357.61.
KOSPI weekly chart analysis overview
The KOSPI Composite weekly chart reflects a bullish trend, identified through Elliott Wave analysis, and structured in an impulsive wave formation. The market is currently positioned in orange wave 3, indicating a continuation of strong upward momentum following the completion of a corrective phase.
This bullish wave development is part of navy blue wave 1, marking the early stage of a broader uptrend within the long-term market cycle. With orange wave 2 now completed, the market has shifted into the dynamic phase of orange wave 3, typically associated with significant price increases and key trading opportunities.
Bullish momentum and trading implications
The ongoing progression of orange wave 3 strengthens positive market sentiment, with expectations of sustained bullish activity. As one of the strongest movements in an impulsive wave sequence, this phase often brings heightened market activity and potential price growth, making it a crucial period for traders and investors.
The invalidation level is set at 2,357.61. A breach of this level would negate the current wave structure, requiring a reevaluation of the wave count and overall market outlook. Therefore, it is critical to monitor price action closely around this threshold.
Conclusion
The KOSPI Composite weekly chart suggests a strong bullish trend, primarily driven by the development of orange wave 3 within navy blue wave 1. The completion of orange wave 2 reinforces upward momentum, presenting promising trading opportunities.
Closely tracking market movements near the invalidation level (2,357.61) is essential to ensure accurate market assessments and strategic trading decisions that align with the prevailing trend.
Technical analyst: Malik Awais.
KOSPI Composite Elliott Wave technical analysis [Video]
Author

Peter Mathers
TradingLounge
Peter Mathers started actively trading in 1982. He began his career at Hoei and Shoin, a Japanese futures trading company.


