KOSPI composite index Elliott Wave technical analysis [Video]
![KOSPI composite index Elliott Wave technical analysis [Video]](https://editorial.fxstreet.com/images/Markets/Equities/display-panel-of-daily-stock-market-59908972_XtraLarge.jpg)
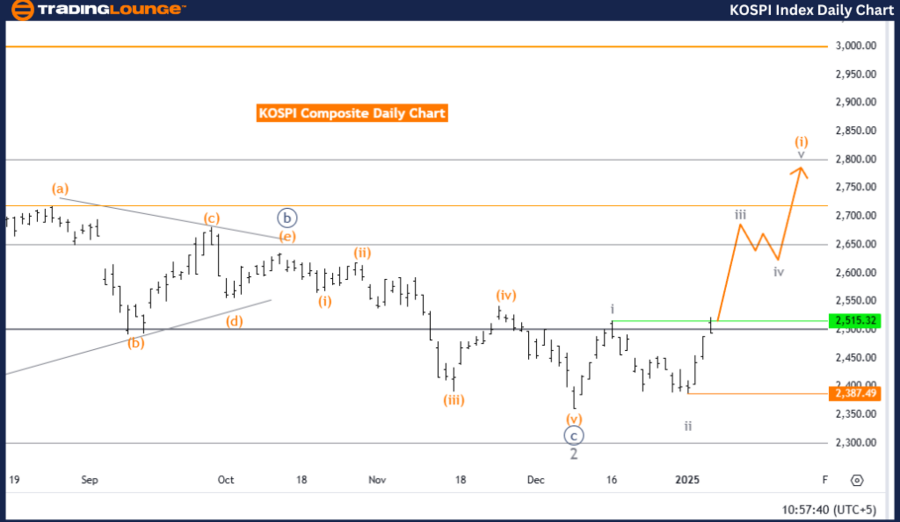
KOSPI Composite Elliott Wave Analysis Trading Lounge Day Chart.
KOSPI composite Elliott Wave technical analysis
-
Function: Bullish Trend.
-
Mode: Impulsive.
-
Structure: Gray Wave 3.
-
Position: Orange Wave 1.
-
Direction next lower degrees: Gray Wave 4.
-
Details: Gray wave 2 appears completed; gray wave 3 of orange wave 1 is now unfolding.
Wave cancel invalidation level: 2,387.49.
The KOSPI Composite Index is currently in a bullish trend, as indicated by the Elliott Wave Analysis on the daily chart. This trend features an impulsive wave structure, with gray wave 3 advancing as part of the larger orange wave 1. The completion of gray wave 2 marks the beginning of gray wave 3 within orange wave 1.
This impulsive phase reflects continued upward momentum, with gray wave 3 representing a strong directional movement in the wave sequence. Once gray wave 3 concludes, the market is expected to enter gray wave 4, which will serve as a corrective phase before the upward trend resumes. These waves align with the Elliott Wave principle of alternating impulsive and corrective phases.
A critical invalidation level is set at 2,387.49. If the price falls below this threshold, the current wave analysis will be invalid, requiring a reassessment of the structure. This level serves as a crucial marker for verifying or negating the ongoing wave scenario.
Summary:
The KOSPI Composite Index is progressing through an impulsive bullish trend, with gray wave 3 advancing within orange wave 1. This stage demonstrates strong upward momentum, with gray wave 4 anticipated as the next corrective movement. The invalidation level at 2,387.49 provides a key reference for ensuring the accuracy of the analysis and guiding expectations for future market movements.
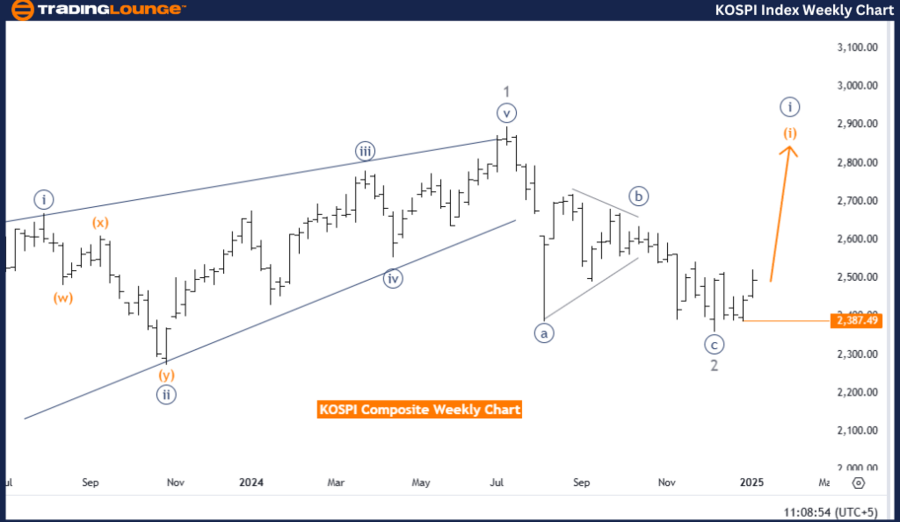
KOSPI Composite Elliott Wave Analysis Trading Lounge Weekly Chart.
KOSPI composite Elliott Wave technical analysis
-
Function: Bullish Trend.
-
Mode: Impulsive.
-
Structure: Orange Wave 1.
-
Position: Navy Blue Wave 1.
-
Direction next lower degrees: Orange Wave 2.
-
Details: Navy blue wave C of gray wave 2 appears completed; orange wave 1 of navy blue wave 1 is now in progress.
Wave cancel invalidation level: 2,387.49.
The KOSPI Composite Index is currently in a bullish trend, as outlined by the Elliott Wave Analysis on the weekly chart. This trend is marked by an impulsive wave structure, with orange wave 1 advancing within the broader navy blue wave 1. The recent completion of navy blue wave C within gray wave 2 signals the end of a corrective phase, paving the way for the development of orange wave 1 of navy blue wave 1.
This impulsive phase indicates the initiation of upward momentum in the larger trend. Once orange wave 1 concludes, the market is expected to enter orange wave 2, a corrective phase, before the overall bullish trend continues. This progression reflects the natural alternation between impulsive and corrective phases as described by Elliott Wave Theory.
A critical invalidation level has been established at 2,387.49. Should the price fall below this point, the current wave interpretation will no longer be valid, necessitating a reevaluation of the structure. This invalidation level acts as an essential benchmark to confirm or refute the ongoing wave scenario.
Summary:
The KOSPI Composite Index is in a bullish trend driven by the impulsive formation of orange wave 1 within navy blue wave 1. The completion of navy blue wave C signifies the conclusion of a corrective phase, setting the stage for further upward movement. The invalidation level at 2,387.49 serves as a key reference to validate the analysis and guide expectations for the next phases of the market trend.
Technical analyst: Malik Awais.
KOSPI composite Elliott Wave technical analysis [Video]
Author

Peter Mathers
TradingLounge
Peter Mathers started actively trading in 1982. He began his career at Hoei and Shoin, a Japanese futures trading company.


