KOSPI Composite Index Elliott Wave technical analysis [Video]
![KOSPI Composite Index Elliott Wave technical analysis [Video]](https://editorial.fxstreet.com/images/Markets/Equities/Industries/Transportation/goods-train2-637435358064652999_XtraLarge.jpg)
KOSPI Composite Elliott Wave technical analysis
Function: Bullish Trend.
Mode: Impulsive.
Structure: Orange wave 3.
Position: Navy blue wave 1.
Direction next higher degrees: Orange wave 3 (started).
Cancel invalid level: 2381.93.
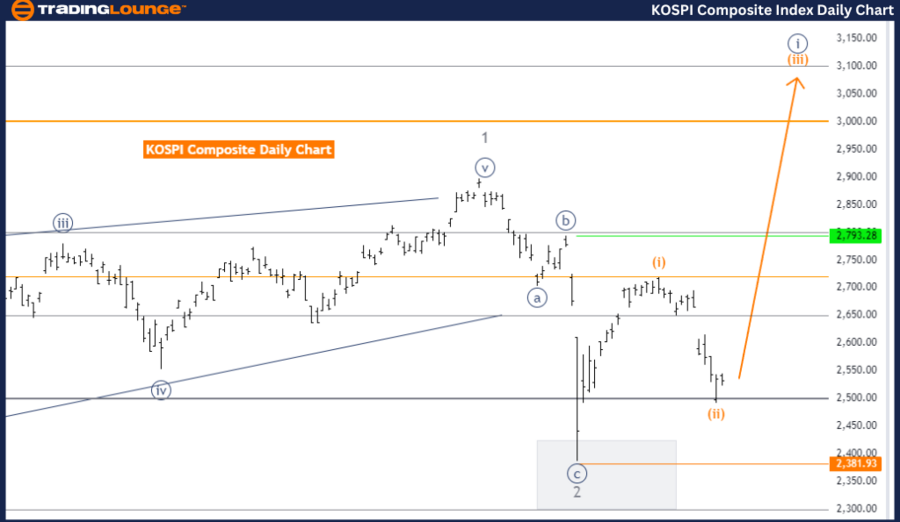
The KOSPI Composite Elliott Wave analysis on the daily chart indicates a bullish trend is present. The market is currently in an impulsive mode, indicating strong upward movement in the price.
The structure under observation is orange wave 3, with the present position in navy blue wave 1. This pattern suggests the early stages of a larger upward movement.
At this point, orange wave 2 appears to be completed. Now, orange wave 3 has started and is actively progressing. This wave continues the bullish trend, pointing to a further upward price movement. The end of wave 2 marks a transition from the corrective phase back into the impulsive and bullish direction.
The next higher degrees align with the ongoing orange wave 3, signifying that the market is anticipated to continue rising. Typically, wave 3 is the strongest and most extended in an Elliott Wave sequence, hinting at substantial upward momentum ahead.
A crucial level to monitor is the wave cancellation invalidation point, set at 2381.93. If the price falls below this level, it would invalidate the current Elliott Wave structure, necessitating a reevaluation of the market trend. However, as long as the price stays above this level, the bullish scenario remains in place, with the potential for continued upward gains.
In summary, the KOSPI Composite is currently experiencing a bullish trend with orange wave 3 in progress. The completion of orange wave 2 signals the start of further upward momentum. As long as the price remains above the invalidation level of 2381.93, the bullish outlook remains valid.
KOSPI Composite Elliott Wave technical analysis
Function: Bullish Trend
Mode: Impulsive
Structure: Orange wave 3
Position: Navy blue wave 1
Direction next higher degrees: Orange wave 3 (started)
Cancel invalid level: 2381.93
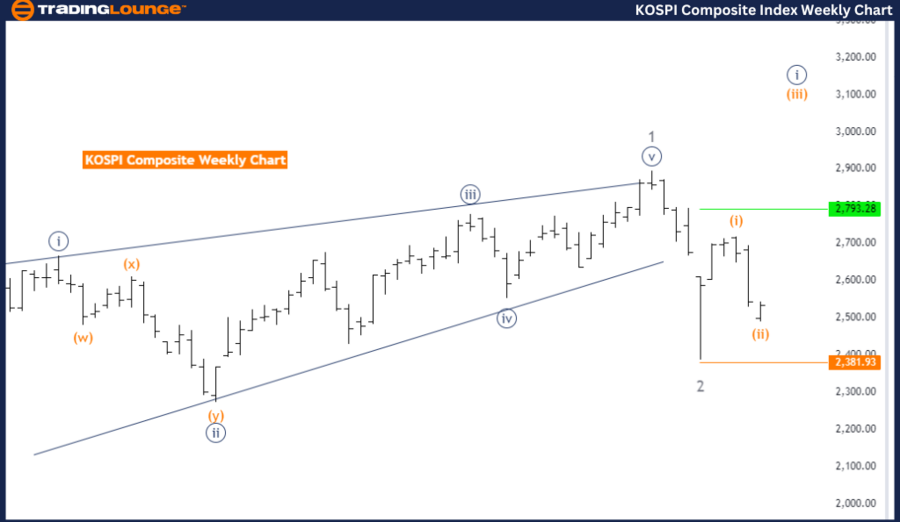
The KOSPI Composite Elliott Wave analysis on the weekly chart highlights a bullish trend. The market is in impulsive mode, reflecting strong upward momentum. The structure currently under observation is orange wave 3, with the present position at navy blue wave 1, indicating that the upward movement is still in its early stages.
Orange wave 2 seems to have completed, and now orange wave 3 has begun, signaling the continuation of bullish momentum. Orange wave 3, being a key component of the Elliott Wave structure, often corresponds with substantial upward price movement, suggesting that the market may experience significant gains during this phase.
The next higher degrees follow the ongoing orange wave 3, which indicates that the market is likely to sustain its upward trend. This wave is typically the strongest and longest in the Elliott Wave sequence, making it vital for confirming the bullish outlook.
A critical invalidation level is set at 2381.93. Should the price fall below this level, the current Elliott Wave structure would be invalidated, raising doubts about the strength of the bullish trend. However, as long as the price remains above this level, the bullish trend continues, with the potential for further upward movement.
In summary, the KOSPI Composite is in a bullish trend on the weekly chart, with orange wave 3 actively in progress. The completion of orange wave 2 supports the beginning of a new upward phase. As long as the price stays above the invalidation level of 2381.93, the market is expected to maintain its strong bullish movement.
KOSPI Composite Index Elliott Wave technical analysis [Video]
Author

Peter Mathers
TradingLounge
Peter Mathers started actively trading in 1982. He began his career at Hoei and Shoin, a Japanese futures trading company.


