KOSPI composite index Elliott Wave technical analysis [Video]
![KOSPI composite index Elliott Wave technical analysis [Video]](https://editorial.fxstreet.com/images/Markets/Equities/Industries/DiversifiedFinancials/calculating-637322940397936981_XtraLarge.jpg)
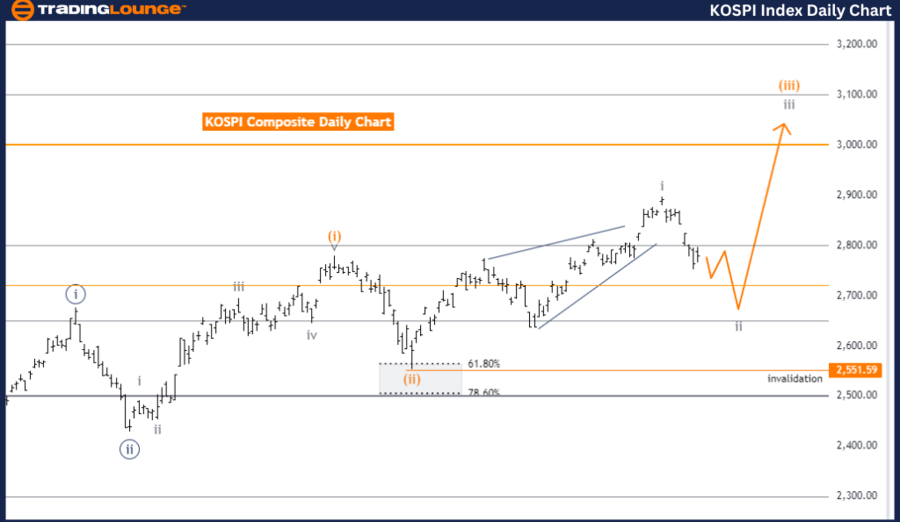
KOSPI composite day chart analysis
Elliott Wave Analysis by Trading Lounge.
Function: Counter Trend.
Mode: Corrective.
Structure: Gray Wave 2.
Position: Orange Wave 3.
Next higher degrees direction: Gray Wave 3.
Wave cancel invalid level: 2551.59.
The KOSPI Composite day chart analysis employs Elliott Wave Theory to provide a detailed examination of market movements. The primary function of the current movement is a counter trend, indicating a move against the primary trend.
Mode and structure:
-
The current mode is corrective, indicating a retracement or consolidation.
-
The structure analyzed is Gray Wave 2, a corrective wave within the larger Elliott Wave framework.
Current position:
-
The market is currently within Orange Wave 3, the third wave of a higher-degree sequence in the orange wave category. According to Elliott Wave Theory, Wave 3 often shows strong, impulsive characteristics.
Next higher degrees:
-
The direction for the next higher degrees is towards Gray Wave 3. After completing the corrective phase of Gray Wave 2, the market is expected to transition into Gray Wave 3, which is anticipated to be an impulsive wave, resuming the primary trend direction.
Details:
-
Following Gray Wave 1, the market is now in the corrective phase of Gray Wave 2 of 3. This phase is crucial as it sets up the market for the next significant move, Gray Wave 3 of 3. Gray Wave 2 is a preparatory phase leading to the next impulsive phase.
Wave cancel invalid level:
-
The critical wave cancel invalid level is set at 2551.59. If the market falls below this threshold, the current wave analysis would be invalidated, requiring a reevaluation of the wave count.
Summary:
-
The KOSPI Composite day chart indicates that the market is in a corrective phase, identified as Gray Wave 2 within Orange Wave 3. The next expected move is a transition into Gray Wave 3, which is anticipated to resume the primary trend. The wave cancel invalid level is set at 2551.59, serving as a key point for validating or invalidating the current wave structure.
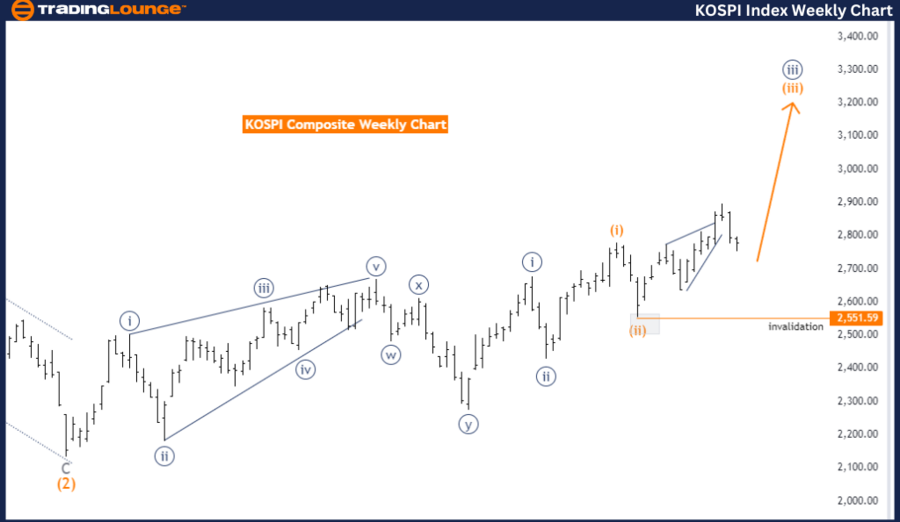
KOSPI composite weekly chart analysis
Elliott Wave Analysis by Trading Lounge.
Function: Trend.
Mode: Impulsive.
Structure: Orange Wave 3.
Position: Navy Blue Wave 3.
Next lower degrees direction: Orange Wave 4.
Wave cancel invalid level: 2551.59.
The KOSPI Composite weekly chart analysis utilizes Elliott Wave Theory to understand market behavior. The function of the current movement is identified as a trend, indicating alignment with the primary direction of the established trend.
Mode and structure:
-
The current mode is impulsive, suggesting strong, directional market moves.
-
The structure under analysis is Orange Wave 3, a significant and typically powerful wave within the broader Elliott Wave sequence.
Current position:
-
The market is currently within Navy Blue Wave 3, a major phase in the market cycle characterized by substantial moves and increased trading activity.
Next lower degrees:
-
The direction for the next lower degrees is towards Orange Wave 4. After completing the impulsive phase of Orange Wave 3, the market is expected to enter a corrective phase, identified as Orange Wave 4, which will likely retrace some gains made during Orange Wave 3.
Details:
-
Orange Wave 2 appears to be completed, setting the stage for the current phase, Orange Wave 3 of 3. This phase is crucial as it represents a strong, impulsive move within the broader trend, often marked by significant price movements and increased volatility.
Wave cancel invalid level:
-
The critical wave cancel invalid level is set at 2551.59. If the market falls below this threshold, the current wave analysis would be invalidated, necessitating a reevaluation of the wave count.
Summary:
-
The KOSPI Composite weekly chart analysis indicates that the market is in an impulsive phase, identified as Orange Wave 3 within Navy Blue Wave 3. The next expected move is a transition into Orange Wave 4, which will be a corrective phase. The wave cancel invalid level is set at 2551.59, serving as a key point for validating or invalidating the current wave structure.
Technical analyst: Malik Awais.
KOSPI composite weekly chart analysis [Video]
Author

Peter Mathers
TradingLounge
Peter Mathers started actively trading in 1982. He began his career at Hoei and Shoin, a Japanese futures trading company.


