KOSPI Composite Elliott Wave technical analysis [Video]
![KOSPI Composite Elliott Wave technical analysis [Video]](https://editorial.fxstreet.com/images/Markets/Equities/Industries/Transportation/goods-train2-637435358064652999_XtraLarge.jpg)
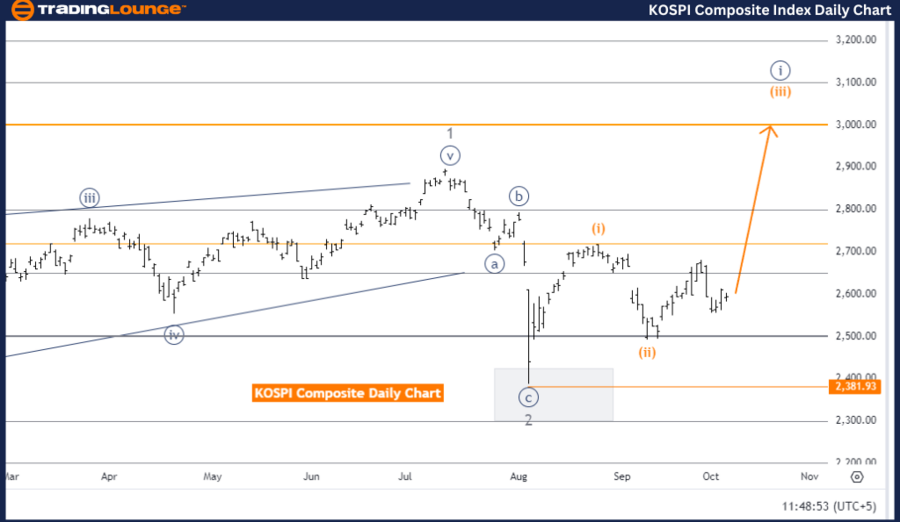
KOSPI Composite Elliott Wave Analysis Trading Lounge Day Chart.
KOSPI Composite Elliott Wave technical analysis
-
Function: Bullish Trend.
-
Mode: Impulsive.
-
Structure: Orange Wave 3.
-
Position: Navy Blue Wave 1.
-
Direction next higher degree: Orange Wave 3 (started).
-
Details: Orange wave 2 appears completed, and now orange wave 3 is in play.
-
Invalidation level: 2381.93.
The KOSPI Composite Elliott Wave analysis on the daily chart indicates a bullish trend currently in progress. This analysis operates in impulsive mode, suggesting the market is undergoing a strong upward movement. The primary focus is on orange wave 3, which signals an important phase of continued growth.
The current wave position is navy blue wave 1, representing the early stage of a broader upward movement. With orange wave 2 completed, the market has transitioned to orange wave 3, which typically brings a more pronounced upward push. According to Elliott Wave theory, wave 3 is often the longest and strongest wave in an impulse sequence.
The higher-degree trend aligns with this bullish momentum, as orange wave 3 has now started, reinforcing expectations of continued upward pressure and rising prices.
The invalidation level for this wave structure is 2381.93. A price drop below this point would invalidate the current Elliott Wave count, implying the bullish trend may not hold, and the wave analysis would need reevaluation. This level acts as a critical threshold for traders, providing a reference for maintaining the bullish outlook.
In summary, the KOSPI Composite daily chart shows a bullish trend in progress, with orange wave 3 active following the completion of orange wave 2. The market is expected to continue upward unless the price drops below 2381.93, which would invalidate the current Elliott Wave count.
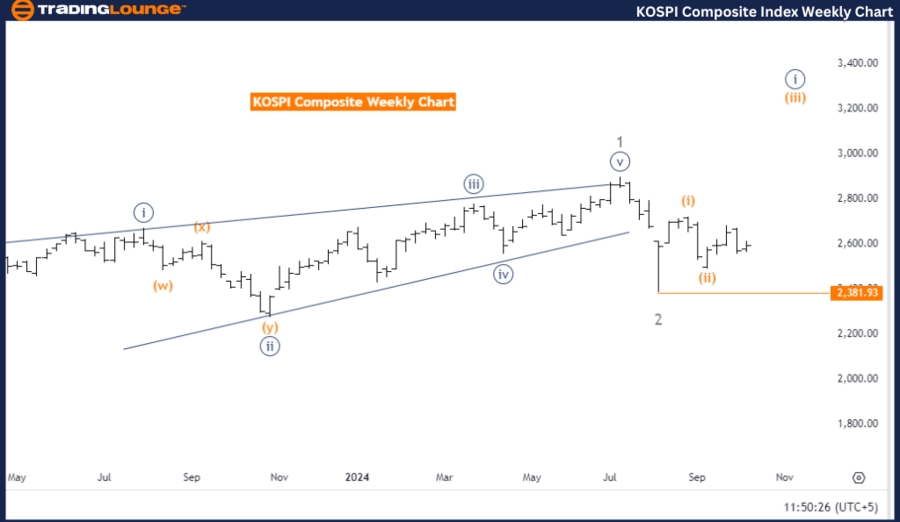
KOSPI Composite Elliott Wave Analysis Trading Lounge Weekly Chart.
KOSPI Composite Elliott Wave technical analysis
-
Function: Bullish Trend.
-
Mode: Impulsive.
-
Structure: Orange Wave 3.
-
Position: Navy Blue Wave 1.
-
Direction next lower degree: Orange Wave 4.
-
Details: Orange wave 2 is completed, and now orange wave 3 is in play.
-
Invalidation Level: 2381.93.
The KOSPI Composite Elliott Wave analysis on the weekly chart points to a bullish trend in impulsive mode, highlighting strong upward momentum in the market. The main structure under observation is orange wave 3, which indicates the market is currently in the midst of a significant upward movement.
The market is positioned within navy blue wave 1, representing the early stage of a larger bullish cycle. The completion of orange wave 2 marks a key transition, and the market is advancing into orange wave 3, which is often associated with a period of strong price appreciation. According to Elliott Wave theory, wave 3 is typically the most dynamic and extended phase in an impulsive sequence.
Looking ahead, the next lower degree signals orange wave 4, a corrective wave that may follow the completion of orange wave 3. However, the current bullish momentum is expected to continue as orange wave 3 progresses, keeping the market outlook positive.
The invalidation level for this wave structure is set at 2381.93. If the price were to drop below this level, it would invalidate the current Elliott Wave count, indicating that the bullish trend may no longer be intact, and the market direction would need to be re-evaluated. This invalidation level serves as a critical point for traders to monitor the sustainability of the upward trend.
In summary, the KOSPI Composite weekly chart analysis suggests the market is in a bullish phase, with orange wave 3 currently active following the completion of orange wave 2. The bullish trend is expected to continue as long as prices stay above 2381.93, the key invalidation level.
Technical analyst: Malik Awais.
KOSPI Composite Elliott Wave technical analysis [Video]
Author

Peter Mathers
TradingLounge
Peter Mathers started actively trading in 1982. He began his career at Hoei and Shoin, a Japanese futures trading company.


