KOSPI Composite Elliott Wave technical analysis [Video]
![KOSPI Composite Elliott Wave technical analysis [Video]](https://editorial.fxstreet.com/images/Markets/Equities/display-panel-of-daily-stock-market-59908972_XtraLarge.jpg)
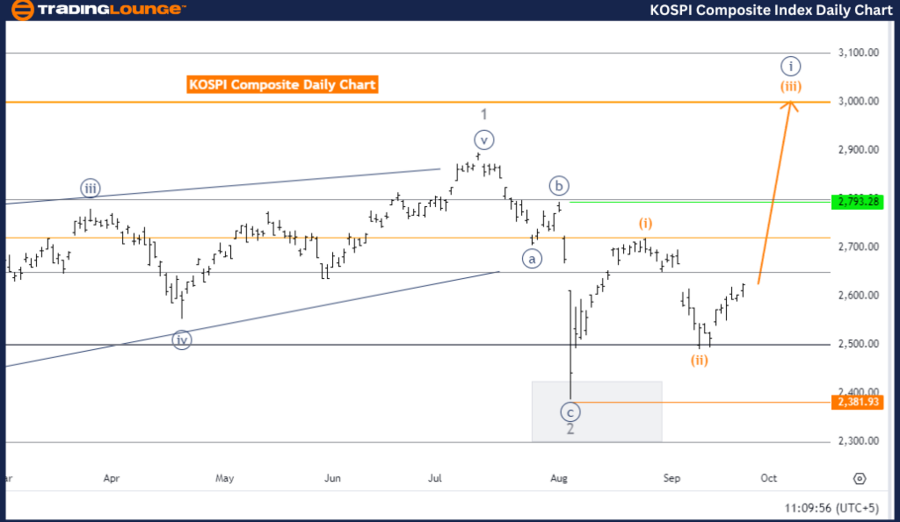
KOSPI Composite Elliott Wave Analysis - Trading Lounge Day Chart
KOSPI Composite Elliott Wave technical analysis
Function: Trend.
Mode: Impulsive.
Structure: Orange wave 3.
Position: Navy Blue Wave 1.
Next lower degrees direction: Orange wave 4.
Invalidation level: 2381.93.
The KOSPI Composite Elliott Wave analysis on the daily chart suggests a developing trend in an impulsive mode. The wave structure currently identified is orange wave 3, indicating that the market is in the early stages of a strong upward movement typical of a third wave in a five-wave sequence. This is positioned as navy blue wave 1.
Key observations:
-
Orange wave 2 (the corrective phase) appears to be completed.
-
Orange wave 3 is now in action, driving the market higher. This phase is typically the strongest in an impulsive wave, leading to significant price gains.
-
Orange wave 4 is anticipated as the next lower-degree direction, marking a potential corrective phase after the completion of orange wave 3.
-
The price could temporarily pull back in wave 4 before continuing upward in wave 5.
If the price falls below 2381.93, the current wave structure would be invalidated, indicating that the expected bullish movement might not unfold as anticipated.
Summary:
The KOSPI Composite daily chart highlights a strong upward trend driven by orange wave 3 after the completion of the corrective orange wave 2. As long as the price stays above 2381.93, the Elliott Wave structure remains valid. A corrective phase in wave 4 is expected once wave 3 concludes, followed by a continuation of the bullish trend in wave 5.
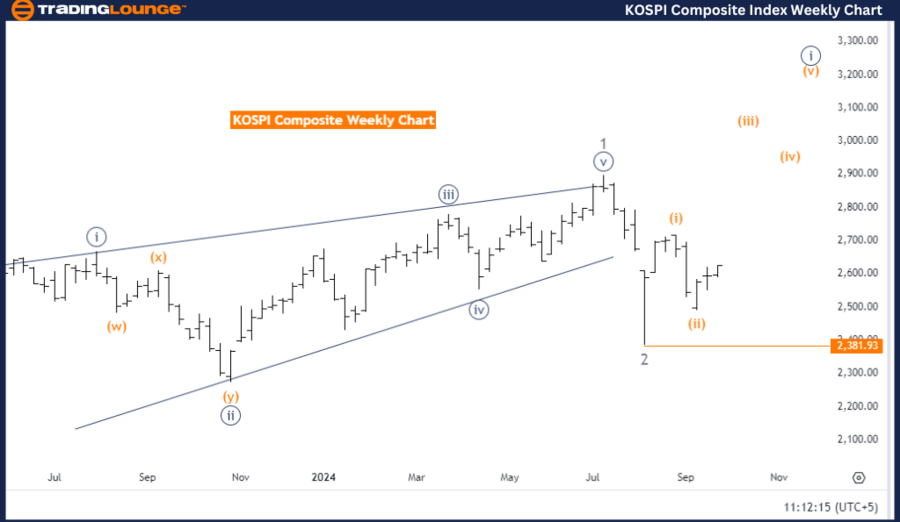
KOSPI Composite Elliott Wave Analysis - Trading Lounge Weekly Chart
KOSPI Composite Elliott Wave technical analysis
Function: Trend.
Mode: Impulsive.
Structure: Orange wave 3.
Position: Navy Blue Wave 1.
Next lower degrees direction: Orange wave 4.
Invalidation level: 2381.93.
The KOSPI Composite Elliott Wave analysis on the weekly chart reveals that the market is in a strong upward trend, following an impulsive wave structure. The current wave is labeled as orange wave 3, indicating a bullish phase within the broader impulsive pattern. This wave is positioned in navy blue wave 1, meaning the trend is still in its early stages.
Key observations:
-
Orange wave 2, which was a corrective phase, appears to be completed.
-
Orange wave 3 is now in progress, driving the market upward. Wave 3 is typically the most powerful and extended wave, characterized by strong bullish momentum.
-
The next expected phase is orange wave 4, which may introduce a brief correction after the completion of wave 3. This corrective phase may lead to a continuation of the bullish trend in wave 5.
The wave structure remains valid as long as the price stays above the invalidation level of 2381.93. If the price drops below this level, it would invalidate the current Elliott Wave count and indicate a potential change in market direction.
Summary:
The KOSPI Composite Weekly Chart shows that the market is continuing its upward trend, with orange wave 3 active after the completion of the corrective orange wave 2. As long as the price remains above 2381.93, the bullish outlook is maintained, though a brief correction in orange wave 4 is expected once wave 3 concludes, followed by further upward movement in wave 5.
Technical analyst: Malik Awais.
KOSPI Composite Elliott Wave technical analysis [Video]
Author

Peter Mathers
TradingLounge
Peter Mathers started actively trading in 1982. He began his career at Hoei and Shoin, a Japanese futures trading company.


