KGHM Polska Miedź S.A. is a multinational corporation which has its headquarters in Lubin, Poland. Traded under tickers $KGH at WSE and $KGHPF in US in form of ADRs, it is a component of the WIG30 index. KGHM has been a major copper and silver producer for more than 50 years. As a matter of fact, it operates 9 underground and open-pit mines located in Poland, USA, Canada and Chile and is actively advancing other projects. KGHM produces key global resources including copper, silver, gold, platinum, nickel and others. Currently, we see indices in short term rally expecting medium term weakness to follow before higher again. That should create sideways to lower effect on KGHM. On the orther hand, metals like copper and silver should continue see support. As a rule, the rally in prices of metals provides a magnifying effect on the share prices of metals producing companies. Therefore, KGHM being one of major producers should become a profitable invetsment target as it should ramp up along with acceleration in commodities prices.
Previously, we have discussed the stock price of KGHM. First, it has demonstrated an impressive rally since our initial article from August 2020. Then, in the article from June 2021, we saw a new all-time high predicting a pullback to happen soon. Indeed, the pullback took place. In the article from August 2022, we have provided with a Daily bluebox area where buyers should have waited to enter the market. Indeed, the reaction has happened form that area. Now, we discuss the targets and provide an outlook.
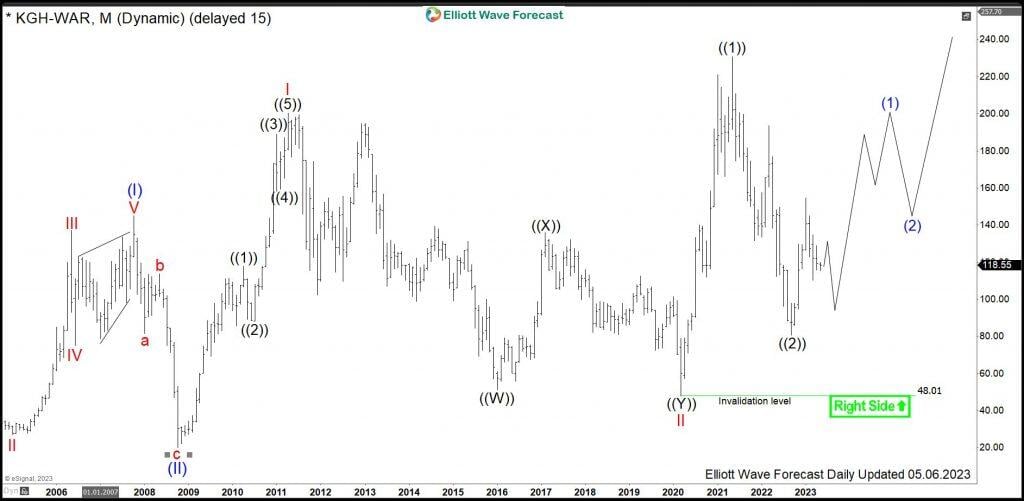
KGHM monthly Elliott Wave analysis 05.06.2023
The monthly chart below shows the KGHM shares $KGH traded at Warsaw Stock Exchange. First, from the all-time lows, the stock price has developed a cycle higher in wave (I). Hereby, KGHM has printed a top in October 2007 at 145. Since the red wave III of blue wave (I) shows a price separation higher, the cycle up is obviously an impulse. From the highs, a correction lower in wave (II) has unfolded as a zigzag correction being a 5-3-5 structure. It has found an important bottom in October 2008 at 20.10.
From the 2008 lows, another motive cycle has started. KGHM has broken the 2007 highs at 145 in a 5 waves move in the red wave I. Hereby, the share price has printed a high in April 2011 at 200.30. From there, a multi-year correction in wave II has started. Hereby, one can recognize a double three pattern. It has ended in March 2020 with a capitulation move down to 48.01. From the March 2020 lows at 48.01, KGHM has started a new cycle higher in wave III of (III). Break to the new all-time highs has confirmed that. The target area for the wave III to end is towards 229.05-340.55 and possibly higher. As of right now, first leg up has reached already the minimum expectations. It is the the preferred view that the leg up is the wave ((1)) of III which has ended at 230.80. From the all-time highs, a pullback in wave ((2)) has ended in September 2022 at 80.68 lows. While above there, black wave ((3)) is in progress.
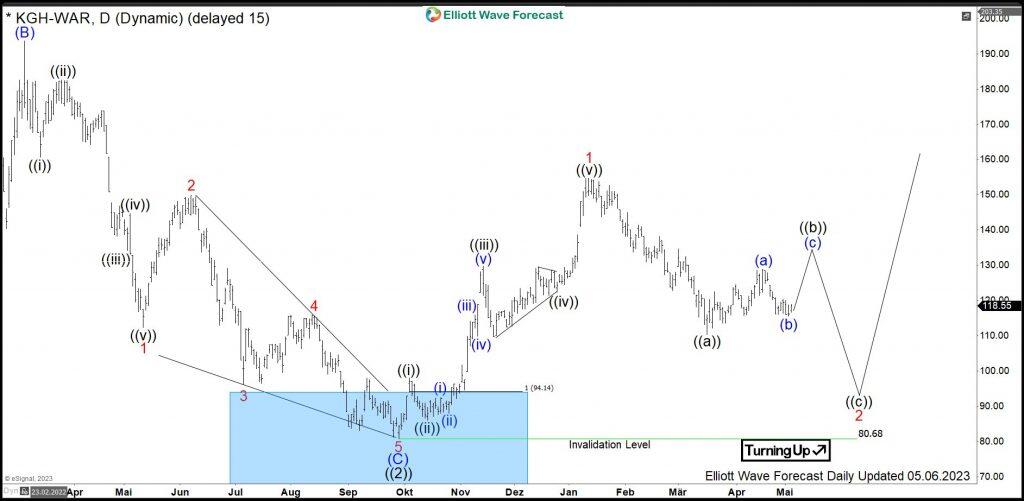
KGHM daily Elliott Wave analysis 05.06.2023
The Daily chart below shows in more detail the final swing lower within pullback from the all-time highs and the initial stages of the black wave ((3)). The consolidation pattern in black wave ((2)) has unfolded as a zigzag pattern. First, impulse in blue wave (A) has found its bottom in November 2021 at 131.50. Then, a bounce in blue wave (B) has set connector in March 2022 at 193.60 (both not shown). From there, wave (C) has been confirmed by breaking 131.50 lows. Diagonal structure in blue wave (C) has reached towards 94.14-48.01 blue box area. There, investors and traders got an opportunity to go long. Now, we see a reaction higher from the area taking place. While price holds above September 2022 lows, new cycle in black wave ((3)) should bring KGHM stock higher. Target is towards 263.34-376.33 area and even beyond. In shorter cycles, red wave 1 has set a medium term peak in January 2023 at 154.70 highs. While below, red wave 2 should correct in 3 or 7 swings the cycle from September 2022 low. Once finished, expect acceleration higher in red wave 3 of blue wave (1) of black wave ((3)).
FURTHER DISCLOSURES AND DISCLAIMER CONCERNING RISK, RESPONSIBILITY AND LIABILITY Trading in the Foreign Exchange market is a challenging opportunity where above average returns are available for educated and experienced investors who are willing to take above average risk. However, before deciding to participate in Foreign Exchange (FX) trading, you should carefully consider your investment objectives, level of xperience and risk appetite. Do not invest or trade capital you cannot afford to lose. EME PROCESSING AND CONSULTING, LLC, THEIR REPRESENTATIVES, AND ANYONE WORKING FOR OR WITHIN WWW.ELLIOTTWAVE- FORECAST.COM is not responsible for any loss from any form of distributed advice, signal, analysis, or content. Again, we fully DISCLOSE to the Subscriber base that the Service as a whole, the individual Parties, Representatives, or owners shall not be liable to any and all Subscribers for any losses or damages as a result of any action taken by the Subscriber from any trade idea or signal posted on the website(s) distributed through any form of social-media, email, the website, and/or any other electronic, written, verbal, or future form of communication . All analysis, trading signals, trading recommendations, all charts, communicated interpretations of the wave counts, and all content from any media form produced by www.Elliottwave-forecast.com and/or the Representatives are solely the opinions and best efforts of the respective author(s). In general Forex instruments are highly leveraged, and traders can lose some or all of their initial margin funds. All content provided by www.Elliottwave-forecast.com is expressed in good faith and is intended to help Subscribers succeed in the marketplace, but it is never guaranteed. There is no “holy grail” to trading or forecasting the market and we are wrong sometimes like everyone else. Please understand and accept the risk involved when making any trading and/or investment decision. UNDERSTAND that all the content we provide is protected through copyright of EME PROCESSING AND CONSULTING, LLC. It is illegal to disseminate in any form of communication any part or all of our proprietary information without specific authorization. UNDERSTAND that you also agree to not allow persons that are not PAID SUBSCRIBERS to view any of the content not released publicly. IF YOU ARE FOUND TO BE IN VIOLATION OF THESE RESTRICTIONS you or your firm (as the Subscriber) will be charged fully with no discount for one year subscription to our Premium Plus Plan at $1,799.88 for EACH person or firm who received any of our content illegally through the respected intermediary’s (Subscriber in violation of terms) channel(s) of communication.
Recommended content
Editors’ Picks

AUD/USD: Further gains look likely above 0.6400
AUD/USD reversed Wednesday’s decline and rose modestly on Thursday, managing to reclaim the area beyond 0.6300 the figure against the backdrop of fresh downside pressure in the Greenback.

EUR/USD met support at the 200-day SMA
EUR/USD rose markedly on Thursday, surpassing the 1.0800 barrier after bottoming out near 1.0730, an area coincident with the critical 200-day SMA, all amid renewed loss of momentum in the US Dollar.

Gold trades around $3,050, higher highs ahead
Relentless tariff jitters, coupled with renewed weakness in the US Dollar, have propelled gold prices back toward record territory—hovering just above $3,060 per troy ounce.

Bitcoin: Should you hold or have a trading system?
The term “HODL,” also known as “Diamond Hands” or “buy-and-hold (BNH),” first appeared in an online cryptocurrency forum in 2013 as a misspelling of the word “hold” — a typo that readers quickly adopted.

US: Trump's 'Liberation day' – What to expect?
Trump has so far enacted tariff changes that have lifted the trade-weighted average tariff rate on all US imports by around 5.5-6.0%-points. While re-rerouting of trade will decrease the effectiveness of tariffs over time, the current level is already close to the highest since the second world war.

The Best brokers to trade EUR/USD
SPONSORED Discover the top brokers for trading EUR/USD in 2025. Our list features brokers with competitive spreads, fast execution, and powerful platforms. Whether you're a beginner or an expert, find the right partner to navigate the dynamic Forex market.

