JP Morgan & Chase Co. (JPM) Elliott Wave technical analysis [Video]
![JP Morgan & Chase Co. (JPM) Elliott Wave technical analysis [Video]](https://editorial.fxstreet.com/images/TechnicalAnalysis/ChartPatterns/PointFigure/hand-of-business-man-write-a-business-graph-59591884_XtraLarge.jpg)
JPM Elliott Wave Analysis Trading Lounge.
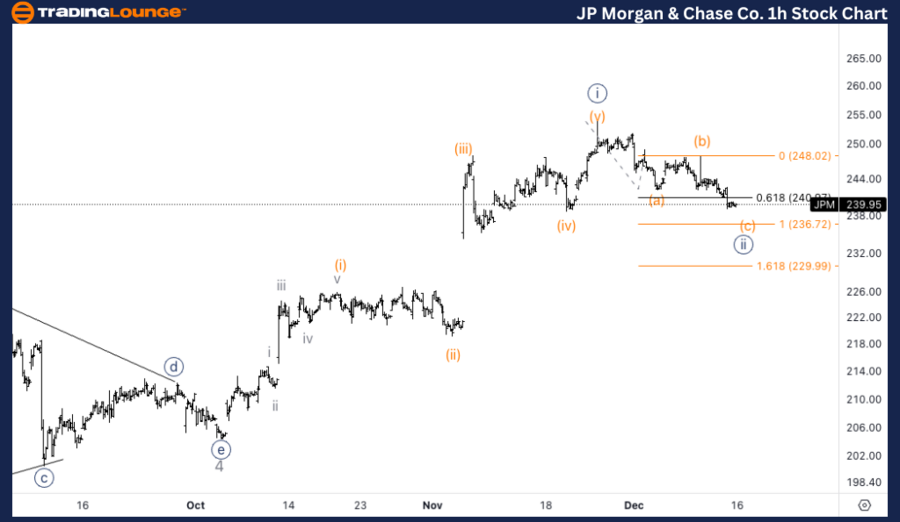
JP Morgan & Chase Co., (JPM) daily chart.
JPM Elliott Wave technical analysis
Function: Trend
Mode: Impulsive
Structure: Motive
Position: Minor wave 5
Direction: Upside in 5 of (5).
Details: Looking for continuation higher into wave 5 as we could be headed towards the next TradingLevel at 300$. If we manage to find support on top of MG1 above 230$ we could see continuation higher.
JPM Elliott Wave technical analysis – Daily chart
The daily chart suggests that Minor wave 5 is in progress, with the stock looking to continue its upward momentum in wave 5 of (5). If support is found above $230 in MG1, we could see further upside towards the next significant TradingLevel at $300. The bullish structure remains intact as long as support holds above this level.
JP Morgan & Chase Co., (JPM) one-hour chart.
JPM Elliott Wave technical analysis
Function: Trend.
Mode: Impulsive.
Structure: Motive.
Position: Wave (c) of {ii}.
Direction: Bottom in wave (c).
Details: Looking for a bottom in wave (c) as we are approaching equality of (c) vs. (a) at 236$.
JPM Elliott Wave technical analysis – One-hour chart
The 1-hour chart shows JPM nearing the end of wave (c) of {ii}, with the stock approaching the equality of (c) vs. (a) at $236. Once this correction completes, we could expect a reversal and the resumption of the bullish trend into the next impulsive wave.
This Elliott Wave analysis for JP Morgan & Chase Co., (JPM) examines both the daily and 1-hour charts to assess its current market trend, utilizing Elliott Wave Theory to anticipate potential future movements.
JP Morgan & Chase Co. (JPM) Elliott Wave technical analysis [Video]
Author

Peter Mathers
TradingLounge
Peter Mathers started actively trading in 1982. He began his career at Hoei and Shoin, a Japanese futures trading company.


