JPM Elliott Wave technical analysis
Function: Trend.
Mode: Impulsive.
Structure: Motive.
Position: Minor wave 5.
Direction: Upside within wave 5.
Details: Looking at the possibility of a wave {i} of 5 completed as we reached 220$ and we could not be looking for a pullbackn in wave {ii} before turning higher. 0.618 wave 5 vs. 1 stands at 254$.
JPM Elliott Wave technical analysis – Daily chart
On the daily chart, JPM is progressing in Minor wave 5, with the first leg, wave {i}, potentially completed after reaching the $220 level. The current outlook suggests a possible pullback in wave {ii} before resuming higher in wave {iii}. A potential upside target for wave 5, assuming it follows the 0.618 extension of the earlier waves, could be around $254.
JPM Elliott Wave technical analysis
Function: Trend.
Mode: Impulsive.
Structure: Motive.
Position: Wave {i} of 5.
Direction: Top in wave {i}.
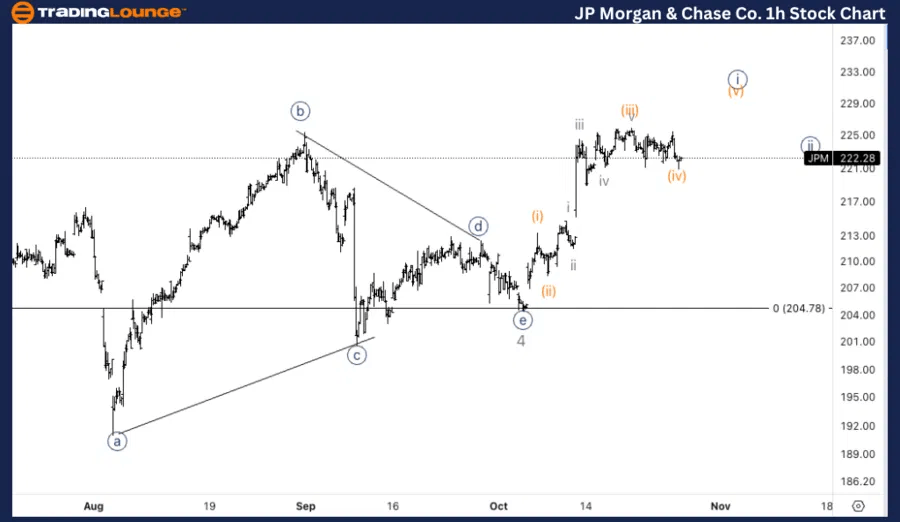
Details: Here’s a little alternate suggesting we could still be within wave {i}, specifically in wave (iv) of {i}, ready to resume higher.
JPM Elliott Wave technical analysis – One-hour chart
The 1-hour chart shows the potential for wave {i} of 5 still being incomplete, with an alternate count suggesting that the current price action may be in wave (iv) of {i}. Once this corrective phase is over, the chart indicates a likely continuation to the upside in wave (v) of {i} to complete the first leg of Minor wave 5.
This Elliott Wave analysis for JP Morgan & Chase Co., (JPM) examines both the daily and 1-hour charts to assess its current market trend, utilizing Elliott Wave Theory to anticipate potential future movements.
JP Morgan & Chase Co. (JPM) Elliott Wave technical analysis [Video]
As with any investment opportunity there is a risk of making losses on investments that Trading Lounge expresses opinions on.
Historical results are no guarantee of future returns. Some investments are inherently riskier than others. At worst, you could lose your entire investment. TradingLounge™ uses a range of technical analysis tools, software and basic fundamental analysis as well as economic forecasts aimed at minimizing the potential for loss.
The advice we provide through our TradingLounge™ websites and our TradingLounge™ Membership has been prepared without considering your objectives, financial situation or needs. Reliance on such advice, information or data is at your own risk. The decision to trade and the method of trading is for you alone to decide. This information is of a general nature only, so you should, before acting upon any of the information or advice provided by us, consider the appropriateness of the advice considering your own objectives, financial situation or needs. Therefore, you should consult your financial advisor or accountant to determine whether trading in securities and derivatives products is appropriate for you considering your financial circumstances.
Recommended content
Editors’ Picks
EUR/USD resumes slide below 1.0500
EUR/USD gained modest upward traction ahead of Wall Street's opening but resumed its slide afterwards. The pair is under pressure in the American session and poised to close the week with losses near its weekly low at 1.0452.
GBP/USD nears 1.2600 as the US Dollar regains its poise
Disappointing macroeconomic data releases from the UK put pressure on the British Pound, yet financial markets are all about the US Dollar ahead of the weekly close. Demand for the Greenback increased in the American session, pushing GBP/USD towards 1.2600.
Gold pierces $2,660, upside remains capped
Gold (XAU/USD) puts pressure on daily lows and trades below $2,660 on Friday’s early American session. The US Dollar (USD) reclaims its leadership ahead of the weekly close, helped by rising US Treasury yields.
Broadcom is the newest trillion-dollar company Premium
Broadcom (AVGO) stock surged more than 21% on Friday morning after management estimated on Thursday’s earnings call that the market for customized AI accelerators might reach $90 billion in fiscal year 2027.
Can markets keep conquering record highs?
Equity markets are charging to new record highs, with the S&P 500 up 28% year-to-date and the NASDAQ Composite crossing the key 20,000 mark, up 34% this year. The rally is underpinned by a potent mix of drivers.
Best Forex Brokers with Low Spreads
VERIFIED Low spreads are crucial for reducing trading costs. Explore top Forex brokers offering competitive spreads and high leverage. Compare options for EUR/USD, GBP/USD, USD/JPY, and Gold.