Johnson & Johnson Earnings: JNJ breaks above resistance following Q1 beat, targets $180


  • Johnson & Johnson beat Q1 consensus on earnings, revenue.
  • JNJ pops 2% on news, moving above $166 resistance point.
  • Sales revenue rises 5.6% YoY.
  • Johnson & Johnson raises full-year guidance.


Johnson & Johnson (JNJ) stock rose 2% in Tuesday's premarket after the healthcare and consumer goods conglomerate reported first quarter adjusted earnings per share (EPS) of $2.68, 18 cents above Wall Street analysts' projections. Revenue of $24.7 billion was also $1.1 billion above consensus. JNJ stock broke above its $166 resistance barrier.

Johnson & Johnson stock news: 2023 guidance raised

Despite poor US retail spending data from last week, Johnson & Johnson's suite of pharamceuticals, medical devices and consumer staples were in strong demand with revenue rising 5.6% YoY. Most of this growth was domestic with the US seeing a 9.7% sales gain YoY. Its foreign operations saw just 1.8% growth YoY.

In addition, management does not seem to see storm clouds on the horizon like a lot of other firms. Full-year 2023 revenue guidance was raised to a range of $97.9 billion to $98.9 billion. The range was boosted by exactly $1 billion on the top and bottom from prior guidance. The range is above Wall Street consensus of $97.65 billion.

Johnson & Johnson also raised its prior range for adjusted earnings of $10.45 to $10.65 per share to $10.60 to $10.70 per share. This is well above Wall Street's projection for $10.51.

“Our first quarter results demonstrate strong performance across all three segments of our business and reflect the dedication of Johnson & Johnson colleagues around the world,” said Chairman and CEO Joaquin Duato. “With this momentum, I look forward to the remainder of the year, one filled with exciting catalysts that will create both near- and long-term value for patients and all of our stakeholders.”

The company did not report any new information regarding its decision two weeks ago to refile bankruptcy proceedings for its TMT subsidiary that houses its talc-based baby powder business, which came under scrutiny for claims that it causes cancer. The company announced on April 4 that it is willing to resolve all claims for $8.9 billion paid over 25 years. 

Johnson & Johnson stock forecast

The weekly chart below shows JNJ stock struggling at the $166 resistance point over the past few weeks. That level is right below the 30-week moving average. However, JNJ stock has shot up to near $169 in the premarket, even breaking above the 30-week moving average in a testament to its bearish year to date price action coming to an end. Expect bulls to target $180 next. That price level is where JNJ stock ran into resistance back in December. The Moving Average Convergence Divergence (MACD) indicator has also crossed over on the weekly chart, which is much more bullish of a signal than a mere daily chart crossover. 
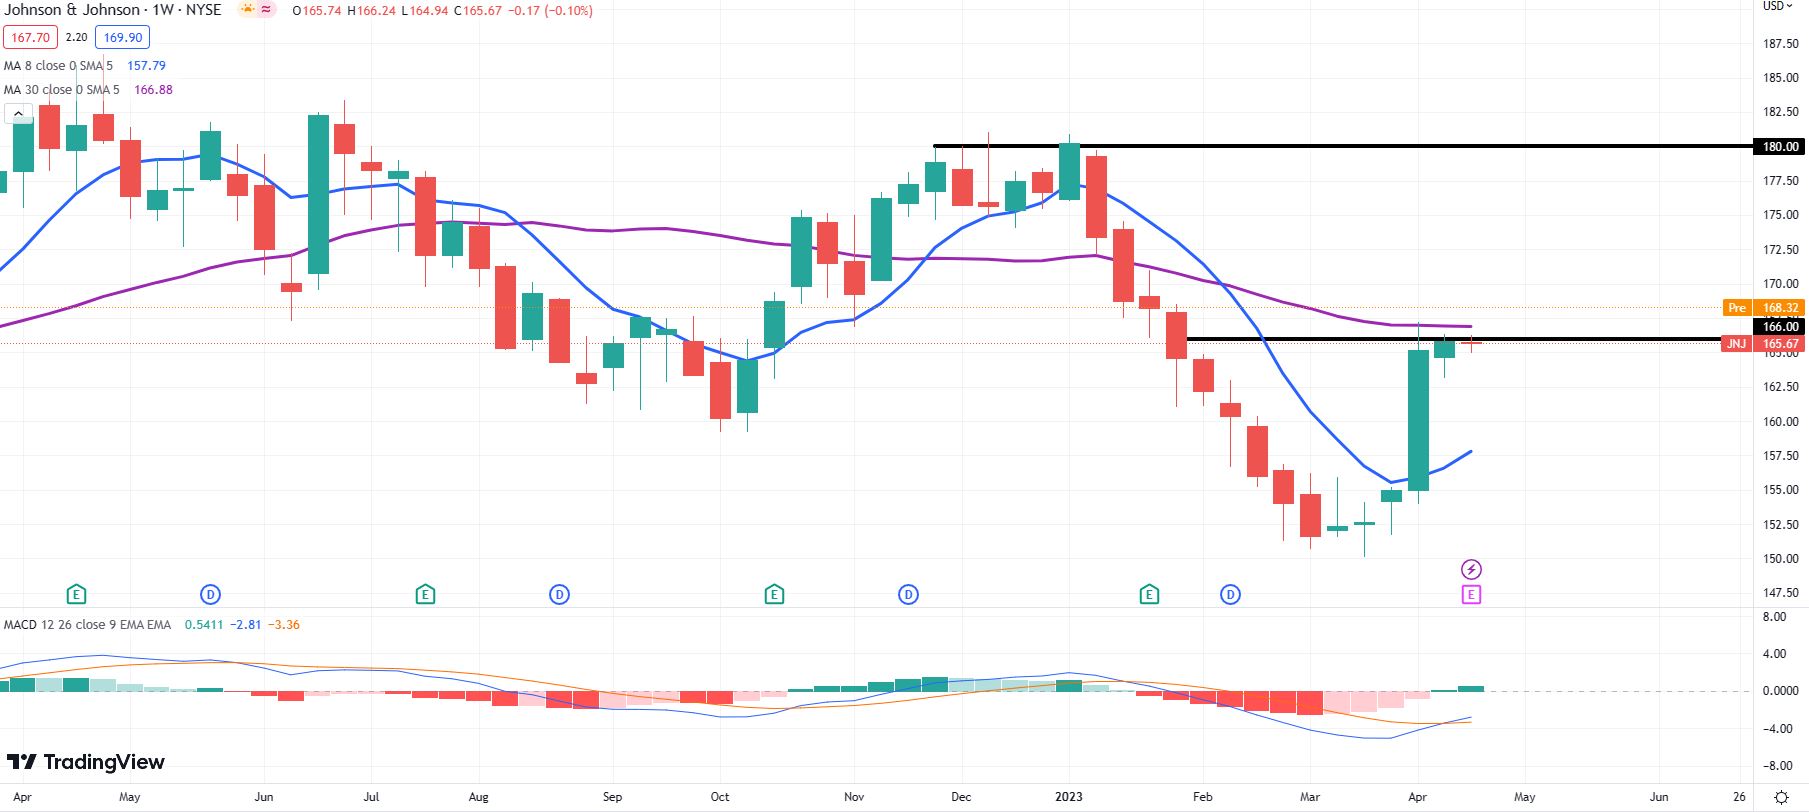
JNJ weekly chart

Share: Feed news

Information on these pages contains forward-looking statements that involve risks and uncertainties. Markets and instruments profiled on this page are for informational purposes only and should not in any way come across as a recommendation to buy or sell in these assets. You should do your own thorough research before making any investment decisions. FXStreet does not in any way guarantee that this information is free from mistakes, errors, or material misstatements. It also does not guarantee that this information is of a timely nature. Investing in Open Markets involves a great deal of risk, including the loss of all or a portion of your investment, as well as emotional distress. All risks, losses and costs associated with investing, including total loss of principal, are your responsibility. The views and opinions expressed in this article are those of the authors and do not necessarily reflect the official policy or position of FXStreet nor its advertisers. The author will not be held responsible for information that is found at the end of links posted on this page.

If not otherwise explicitly mentioned in the body of the article, at the time of writing, the author has no position in any stock mentioned in this article and no business relationship with any company mentioned. The author has not received compensation for writing this article, other than from FXStreet.

FXStreet and the author do not provide personalized recommendations. The author makes no representations as to the accuracy, completeness, or suitability of this information. FXStreet and the author will not be liable for any errors, omissions or any losses, injuries or damages arising from this information and its display or use. Errors and omissions excepted.

The author and FXStreet are not registered investment advisors and nothing in this article is intended to be investment advice.

Recommended content


Recommended content

Editors’ Picks

AUD/USD consolidates near 19-month peak as traders await US PCE Price Index

AUD/USD consolidates near 19-month peak as traders await US PCE Price Index

AUD/USD oscillates in a range below the 0.6900 mark, as traders opt to move to the sidelines ahead of the US PCE Price Index. In the meantime, the RBA's hawkish stance, the optimism led by additional monetary stimulus from China, the prevalent risk-on mood, and a bearish USD continue to act as a tailwind for the pair.

AUD/USD News
USD/JPY holds above 145.00 after the Tokyo CPI inflation data

USD/JPY holds above 145.00 after the Tokyo CPI inflation data

The USD/JPY pair attracts some buyers to near 145.20 on Friday during the early Asian session. The pair gains ground near three-week highs after the Tokyo Consumer Price Index. The attention will shift to the US Personal Consumption Expenditures Price Index for August, which is due later on Friday. 

USD/JPY News
Gold price holds steady near record peak; looks to US PCE data from fresh impetus

Gold price holds steady near record peak; looks to US PCE data from fresh impetus

Gold price consolidates below the all-time high set on Thursday amid overbought conditions on the daily chart and the risk-on mood, though dovish Fed expectations continue to act as a tailwind. Bulls, meanwhile, prefer to wait for the release of the US PCE Price Index before placing fresh bets. 

Gold News
Ethereum investors show bullish bias amid ETF inflows and positive funding rates, exchange reserves pose risk

Ethereum investors show bullish bias amid ETF inflows and positive funding rates, exchange reserves pose risk

Ethereum traded around $2,640 on Thursday, up more than 2% following increased bullish bias among investors, as evidenced by ETH ETF net inflows and an uptrend in funding rates. However, investors may be wary of a potential correction from ETH's rising exchange reserve.

Read more
RBA widely expected to keep key interest rate unchanged amid persisting price pressures

RBA widely expected to keep key interest rate unchanged amid persisting price pressures

The Reserve Bank of Australia is likely to continue bucking the trend adopted by major central banks of the dovish policy pivot, opting to maintain the policy for the seventh consecutive meeting on Tuesday.

Read more
Five best Forex brokers in 2024

Five best Forex brokers in 2024

VERIFIED Choosing the best Forex broker in 2024 requires careful consideration of certain essential factors. With the wide array of options available, it is crucial to find a broker that aligns with your trading style, experience level, and financial goals. 

Read More

Forex MAJORS

Cryptocurrencies

Signatures