Johnson & Johnson Deep Dive: HOLD on JNJ stock with $156 price target

Welcome back to our deep dive series where this time we are focusing on Johnson & Johnson (JNJ). This is one of the more defensive names and perhaps a more fitting investment for the times we live in with a raging bear market and sticky inflation. As ever we will outline the backdrop of the company, including some history as well as its current structure. Then we get down to the main valuation metrics before adjusting for macroeconomic conditions and finally completing some technical analysis. This will then lead us to our 12-month price target.
Contents
- Company overview and history
- Wall Street consensus forecasts
- Key valuation rating metrics
- Macroeconomic backdrop, market cycle and sector analysis
- Recent news and earnings
- Forecast and valuation
- Technical analysis
- Executive summary, recommendation and price target
Johnson & Johnson company overview and history
Johnson & Johnson trades under the ticker symbol JNJ and has a long and storied history. The company was first incorporated in 1887, but its origins go back to the Civil War. It is a fascinating story – one that deserves a separate article. For those with an eye on history, Johnson & Johnson has an excellent background website.
The younger Johnson brother, Robert Wood, was too young to fight in the Civil War so began his training in a family pharmacy. Upon attending the World Fair and listening to Joseph Lister's theory on antiseptic surgery, he became convinced that this was the way forward. In 1886 Robert Wood and his two brothers formed Johnson & Johnson to manufacture antiseptic medical supplies, and the company quickly became a world leader in the field. In 1944 the company was listed on the New York Stock Exchange, and the company did so via IPO. In 1963 Philip Hofman became the first non-Johnson family member to be made CEO.
Johnson & Johnson operates under three business segments: Consumer Health, Medical Devices and Pharmaceutical Devices. The consumer division includes many products found in homes all over the world. Products such as Listerine, Aveeno, Pepcid, Band-aid, etc. The medical devices sector includes products used to treat a range of ailments such as diabetes, and cardiovascular and vision sicknesses. Pharmaceutical devices include such areas as oncology, immunology and, most notably in current times, infectious diseases and vaccines.
Healthcare is one of the more defensive sectors of the stock market. It tends to underperform in high-growth bull markets but outperforms in the current environment. Below we can see the year-to-date performance of JNJ versus the S&P 500 and Nasdaq. Johnson&Johnson stock is down slightly less than 4% this year. Meanwhile, the Nasdaq is looking at a 34% loss; and the S&P 500, a loss of 24%.
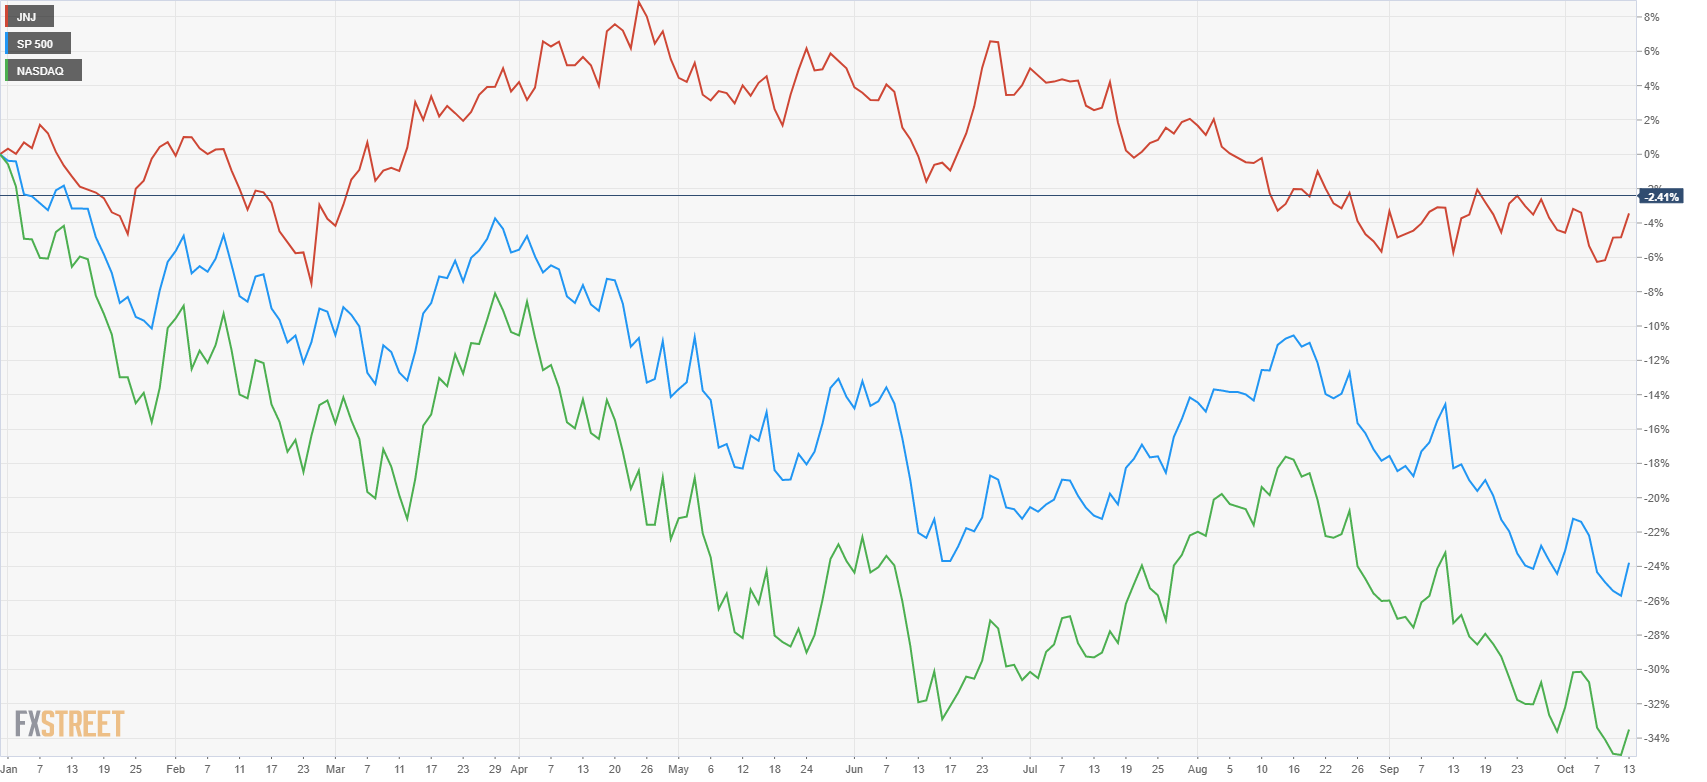
JNJ (red) versus S&P 500 (blue) and Nasdaq (green)
Also read: Amazon Stock Deep Dive: AMZN price target at $106 with near-term risks offset by long-term growth
Below if we look at the past five years, the picture totally changes. JNJ is up just under 19%, while the Nasdaq has added 74%, and the S&P 500 has advanced 38%, a vast outperformance.
-638016836677599619.png)
JNJ (red) versus S&P 500 (blue) and Nasdaq (green)
JNJ Stock: Wall Street consensus forecasts
Wall Street analysts as ever are bullish on JNJ stock. The average price target has barely moved this year and neither has the stock itself. The current average price target is $185.40. At the time of writing, JNJ stock is trading at $166.59, so a premium of just under $20 or 12% above the current market price.
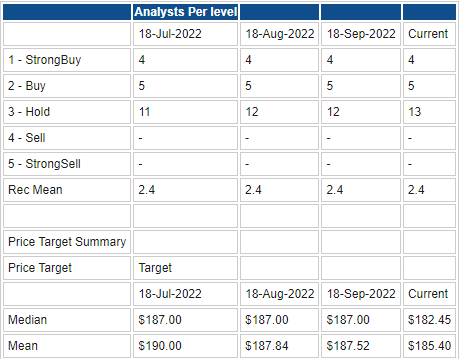
Source: Refinitiv
Also read: Tesla Stock Deep Dive: Price target at $400 on China headwinds, margin compression, lower deliveries
Key valuation rating metrics
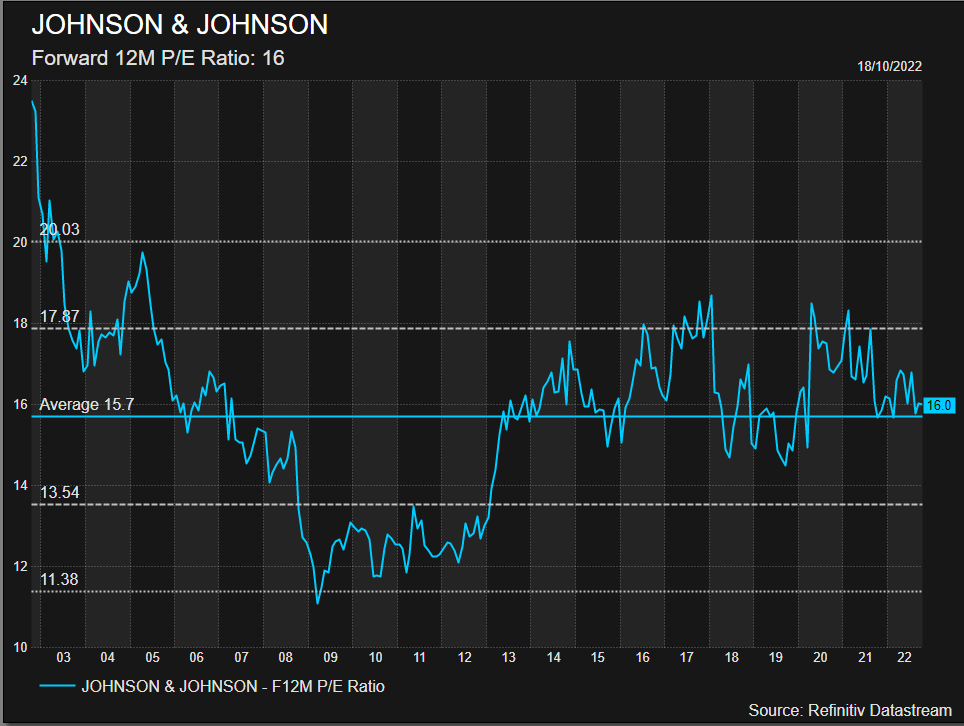
JNJ trades on a P/E of 16, which looks a little high compared to Pfizer (PFE), but JNJ does offer a more broad-based consumer exposure, which usually trades on a higher multiple.
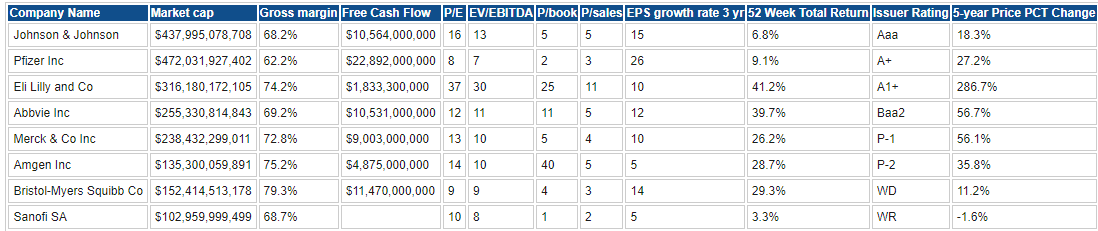
Source: Refinitiv
Also read: Citi Stock Deep Dive: Earnings, Buffet factor support our BUY rating and $60 price target
Macroeconomic backdrop, market cycle and sector analysis
The world economy clearly faces many challenges, which are by now well-established. As a result, global equity markets are nearly all in bearish territory, and the US main indices find themselves both strongly in negative territory for the year. Now the key question is – are we in or about to enter a recession? The reason that is so crucial is because of what happens to valuations in a recession. P/E multiples fall, meaning there is more pressure on stock prices. Currently, stock prices are not cheap despite a year of falling prices and lowered P/E ratios.
Stocks still are not cheap, and the E in P/E is likely to be further compressed.
— Markets & Mayhem (@Mayhem4Markets) October 18, 2022
During the average recession earnings come down 30%, which would suggest that not only are stocks not cheap, but that most of the risk has yet to be priced in. pic.twitter.com/yh7Ba3r7wI
Despite the massive stock market decline this year, equities are not cheap. For the umpteenth time, “Equities represent return free risk.” pic.twitter.com/TOK1nQGDEV
— George Noble (@gnoble79) October 16, 2022
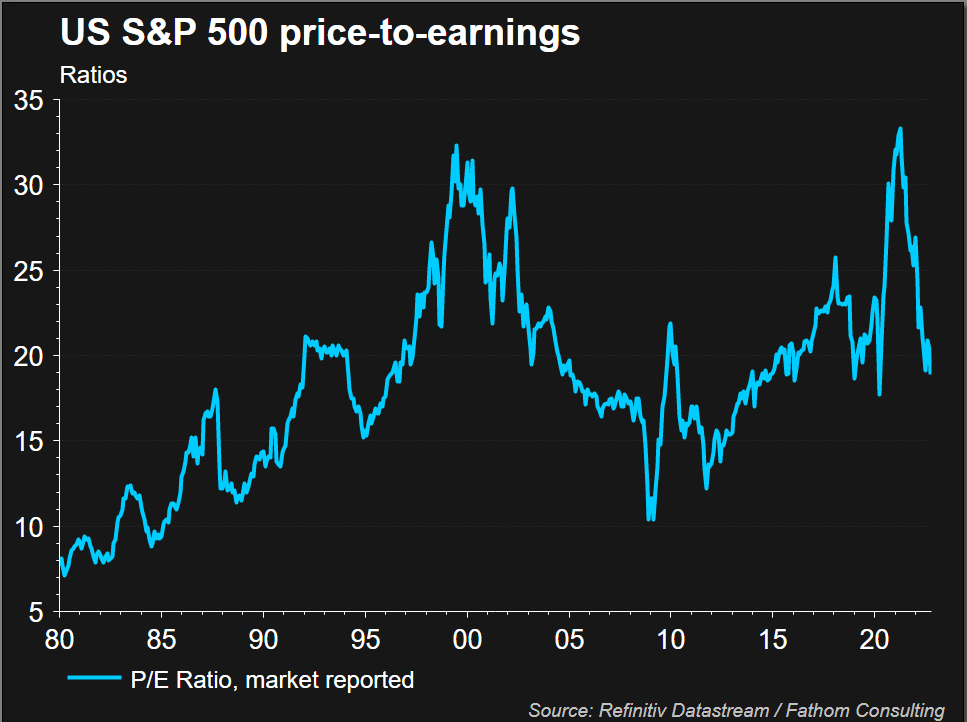
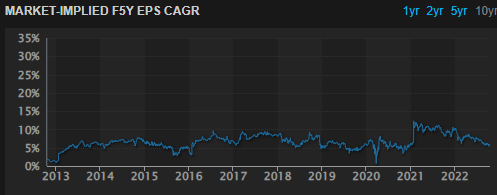
As we can see, equity valuations have come back to some normality after the massive stimulus following the Great Financial Crisis, which accelerated post-pandemic. Now at least things look a little better but are probably still overvalued. With interest rates and inflation continuing to rise, it seems logical to suggest a further contraction in valuation ratios for the time being. Specifically for JNJ, this means we could see more downside in terms of the valuation as P/E ratios continue to adjust downward as interest rates, inflation and a likely recession continue to weigh on investors' minds.
The Price to Earnings Ratio (P/E) is higher when inflation is low and growth rates are high. During stagflation or times when growth is slow & inflation is high, the P/E ratio goes down. In the stagflationary '70s, the P/E for the S&P 500 $SPY went to single digits. pic.twitter.com/l86bRaKLxz
— Ben Woodward, CFA (@BennettWoodman) September 9, 2022
For JNJ, its own P/E ratio has fallen back to 16, which is its long-term average. However, we can see in the last recession, that it fell to between 12 and 14.
Inflation continues to be a problem, and it seems the Fed will remain on its current path of tightening interest rates. Recent employment and CPI data have confirmed that the employment market remains tight and can sustain more rate hikes while CPI remains elevated.
Recent Johnson & Johnson news and earnings
JNJ stock reported earnings on October 18 that did beat estimates on both metrics: EPS and revenue. However, analysts had reduced forecasts several times this year as JNJ has issued caution in relation to currency impacts as well as concerns over vaccine revenues. A glut of vaccines exists now globally.
Q3 EPS came in at $2.55 versus consensus at $2.49. Revenue for the third quarter was $23.8 billion versus the $23.4 billion consensus. Crucially, the company has also maintained its full-year guidance. So far the market has taken the earnings well, and JNJ stock is trading 2% higher in the premarket. However, the conference call is where more discussions will take place over FX headwinds and vaccine demand going forward. Certainly, at first glance though, the number reassures us of the stable and defensive nature of JNJ.
Also read: Apple Stock Deep Dive: AAPL price target at $100 on falling 2023 revenues
Johnson & Johnson forecast and valuation
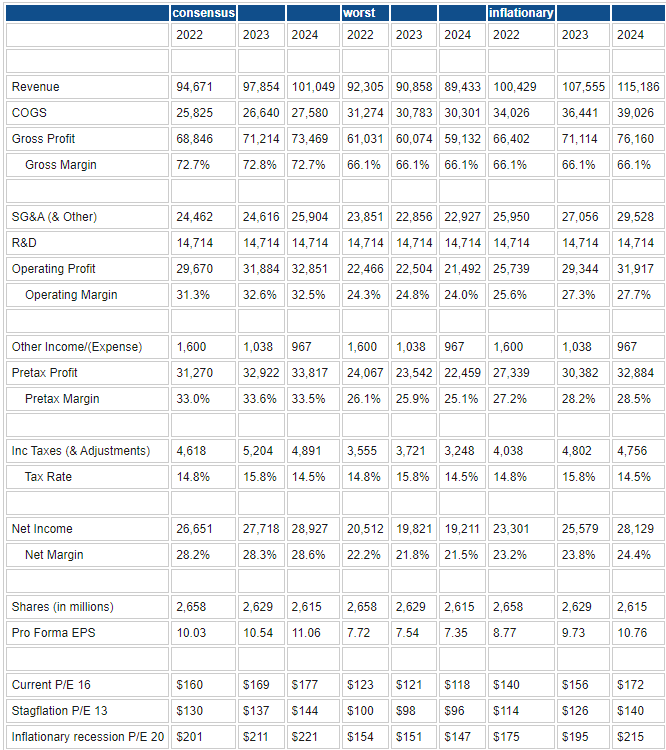
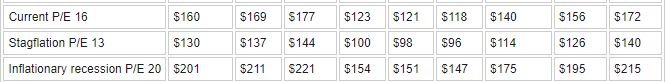
Below we take the Refinitiv-reported data and consensus. We outline the various scenarios for earnings based on macroeconomic and valuation factors. We then apply various P/E ratios to EPS, so we can see the projected share price outcomes under different conditions. This includes recessionary periods and high inflation periods. We also compare valuations across the industry versus the S&P 500 and versus peers.
We have outlined three scenarios below and adjusted revenue and margins accordingly. The first is to run with consensus. Then we run with the worst-case scenario for both revenues and margins. This is your financial crisis-style outcome. Finally, we make an adjustment for an inflationary environment where nominal revenues increase due to the effects of inflation, but margins are also squeezed by inflationary pressures. This is my projected scenario for the next 12 months.
History shows that when inflation breaches 5%, it takes years rather than months for it to come back down. We are in either an inflationary recession or possibly an inflationary slowdown. Despite all the doom and gloom, the US is not in a recession, although by some measures it is.
It may manage to avoid it, but the world is a different case, and Europe is in a more perilous position than the US. The UK is also in deep economic trouble. JNJ is a global company. Again though history shows us that by and large the early stages of an inflationary period are the most beneficial to corporate earnings. Cost issues can be passed onto consumers, who are slower to adapt their behaviors on lower-cost items such as consumer staples and healthcare. JNJ also benefits on the consumer side from the lack of cheap branded alternatives. In the device sector, products tend to be more price inelastic.
Source: Refinitiv
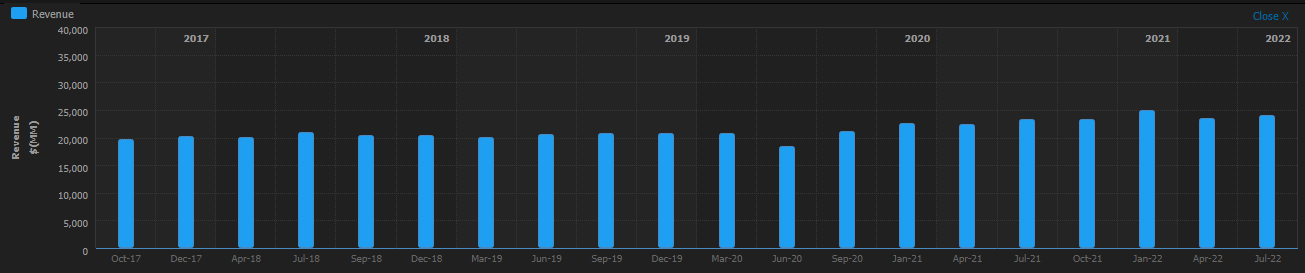
Below we run through some balance sheet and cash flow charts showing just how stable JNJ is. Revenue is stable and growing.
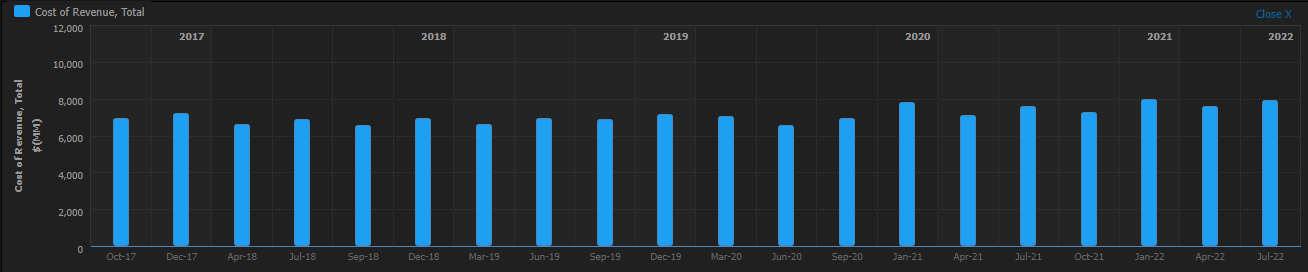
Costs are controlled and also stable.
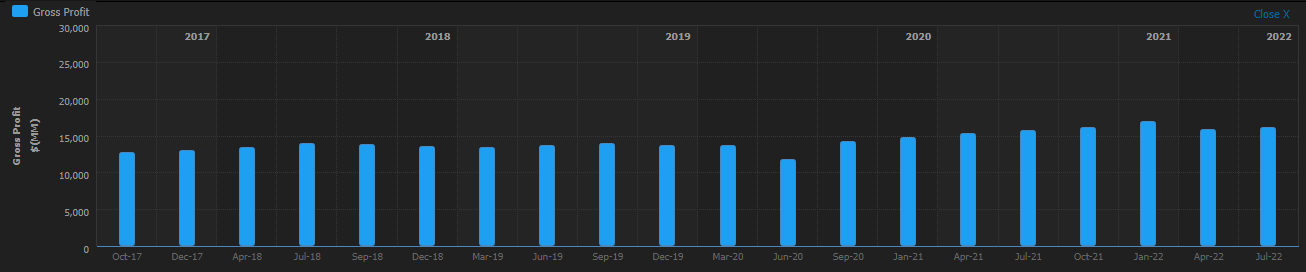
Profit are also stable.
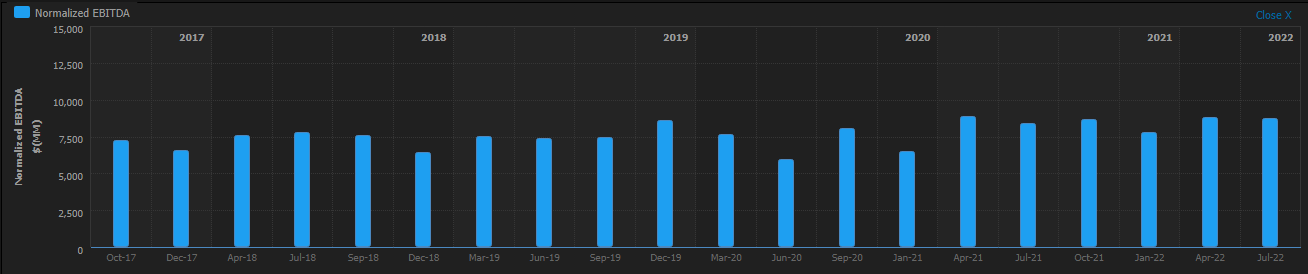
EBITDA (earnings before interest tax and depreciation) are also stable.
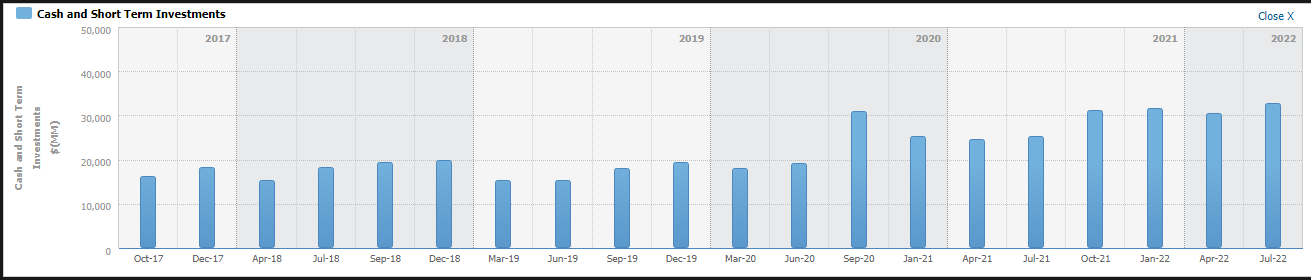
Cash balances are rising steadily.
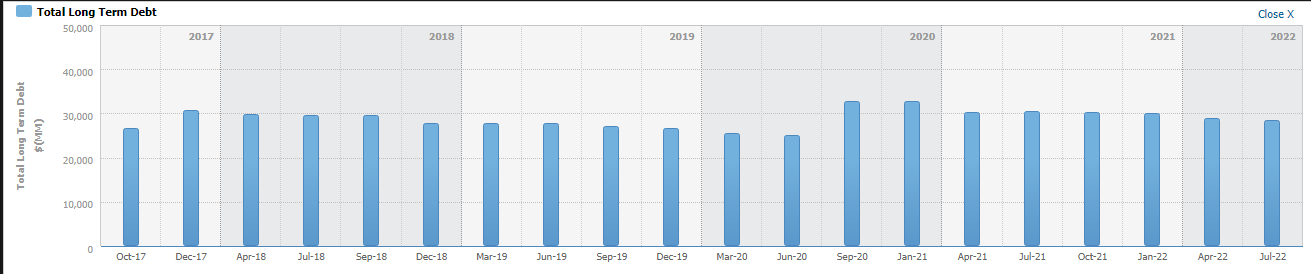
Debt levels are stable and have been falling slightly over the past two years.
Source: Refinitiv
EPS growth rates have remained between 5% and 10% for the last decade.
Source: Refinitiv
What we are looking at here is stability. This is not high-growth, home-run investing. This is not Tesla or Netflix. This is a long-term stable business that also pays a dividend of just under 3%. Now looking again at our revenue and margin outcomes, for the next 12 months we are entering an inflationary recession in my view. That leads to a P/E of between the current 16 and 20.
However, there is one caveat. This is one of the most anticipated recessions ever. We now live in an interconnected information overload world. This has meant investors have reacted with record speed to the changing economic landscape. This means the valuations and so P/E ratios have adjusted across all sectors. In my view, this makes the status quo for the next 12 months the most likely outcome for JNJ. It seems unreasonable for the P/E to move higher when the world economy is deteriorating. A price target based on current levels seems the more likely outcome – $156.
Johnson & Johnson technical analysis
$156 is a strong support zone with multiple tests of the level. First, it worked in the early stages of the pandemic when it was strong resistance. Eventually, it gave way, but $156 has since acted as support in March, April and November of 2021 and also in February of 2022. Also of note is the strong 200-week moving average just below at $153.50. Apart from the pandemic sell-off, JNJ stock has not traded below its 200-week moving average since 2010, and that was the financial crisis crash rating.
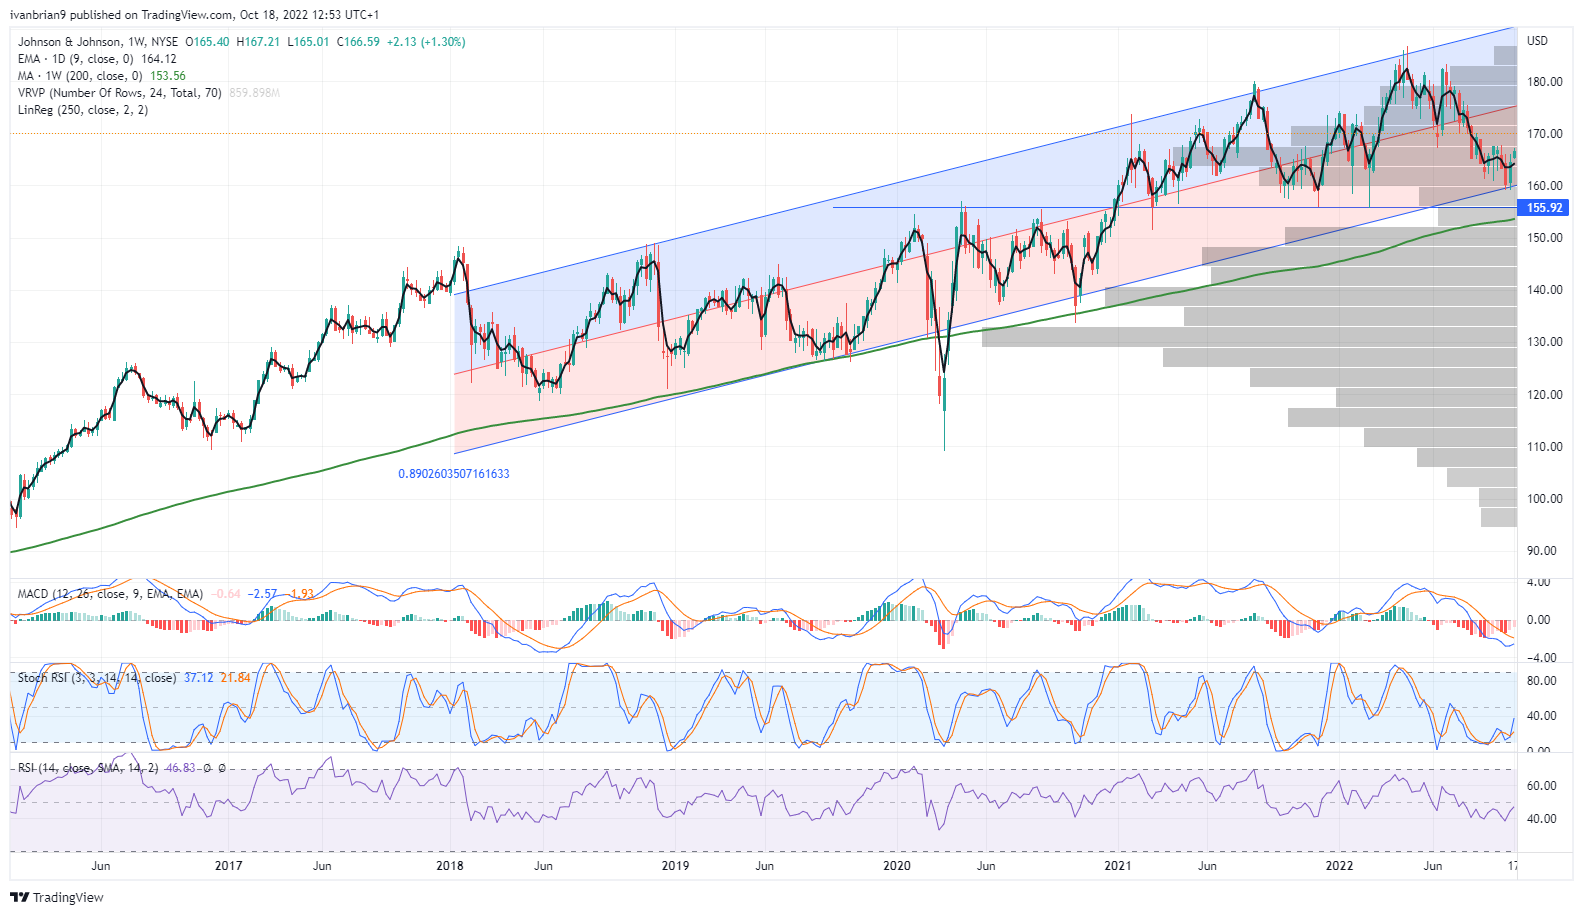
JNJ stock chart, weekly
Johnson & Johnson: Executive summary, recommendation and price target
Currently, the equity market has front run quite a large proportion of the current economic conditions and may actually have gotten slightly overstretched. Inflation remains a problem, so interest rates will continue to rise. This will hit high-duration growth stocks, but JNJ is clearly not in this category. It is defensive in nature. Already we see the yearly performance far outstripping the growth sector. Earnings should continue to remain stable while inflationary pressures could provide a benefit to revenues. If JNJ can keep costs controlled, then it has the potential to again outperform. On a 12-month time horizon, we see JNJ as worthy, therefore, of a HOLD rating with a $156 price target.
Upside risks
- Revenue is boosted in nominal terms by strong inflation.
- Recession does not materialize.
Downside risks
- The strong dollar continues to hurt JNJ's overseas revenues.
- Strong global recession.
Premium
You have reached your limit of 3 free articles for this month.
Start your subscription and get access to all our original articles.
Author

Ivan Brian
FXStreet
Ivan Brian started his career with AIB Bank in corporate finance and then worked for seven years at Baxter. He started as a macro analyst before becoming Head of Research and then CFO.


