Johnson and Johnson Elliott Wave technical analysis [Video]
![Johnson and Johnson Elliott Wave technical analysis [Video]](https://editorial.fxstreet.com/images/Markets/Equities/SP500/wall_street_nyse3-637299021683820849_XtraLarge.jpg)
JNJ Elliott Wave analysis trading lounge daily chart
Welcome to our JNJ Elliott Wave Analysis Trading Lounge, where we delve into Johnson & Johnson (JNJ) using Elliott Wave Technical Analysis. Let's explore the market dynamics on the Daily Chart as of March 26, 2024.
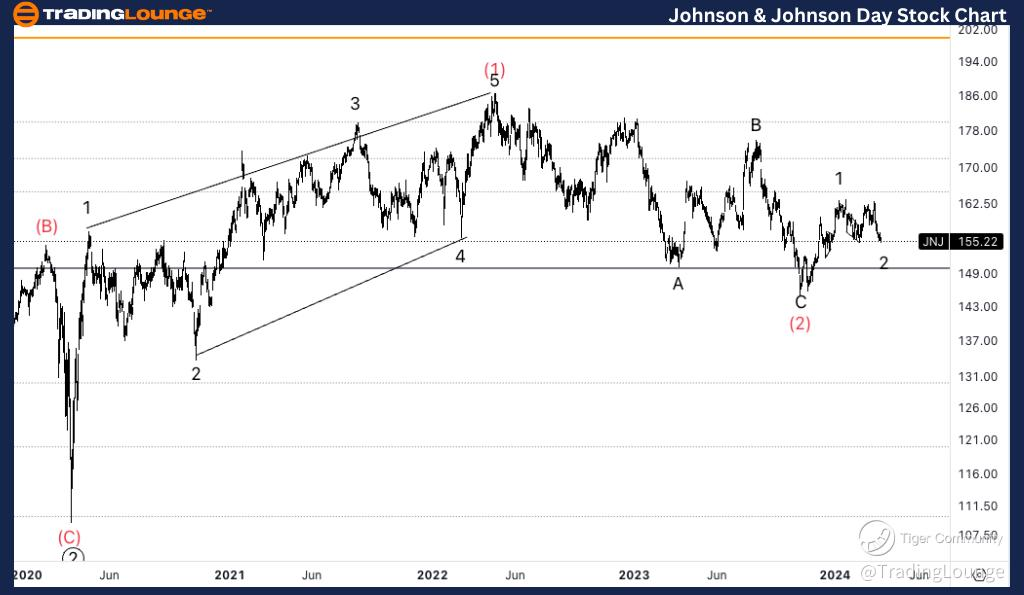
Johnson & Johnson, (JNJ) Daily Chart.
JNJ Elliott Wave Technical Analysis.
Function: Trend.
Mode: Impulsive.
Structure: Motive.
Position: Wave (3).
Direction: Upside in wave 3 of (3).
Details: Looking for a three wave move into wave (2) to be completed as we found support on Medium Level at 150$. We are still in the need of upside confirmation into wave (3).
JNJ Elliott Wave technical analysis – Daily chart
Our analysis reveals a trending function characterized by impulsive mode and motive structure, positioned in Wave (3). The direction signals upside momentum in wave 3 of (3). Currently, we anticipate the completion of a three-wave move into wave (2), with support identified at the Medium Level of $150. However, we await confirmation of the upward trajectory into wave (3).
JNJ Elliott Wave analysis trading lounge four-hour chart
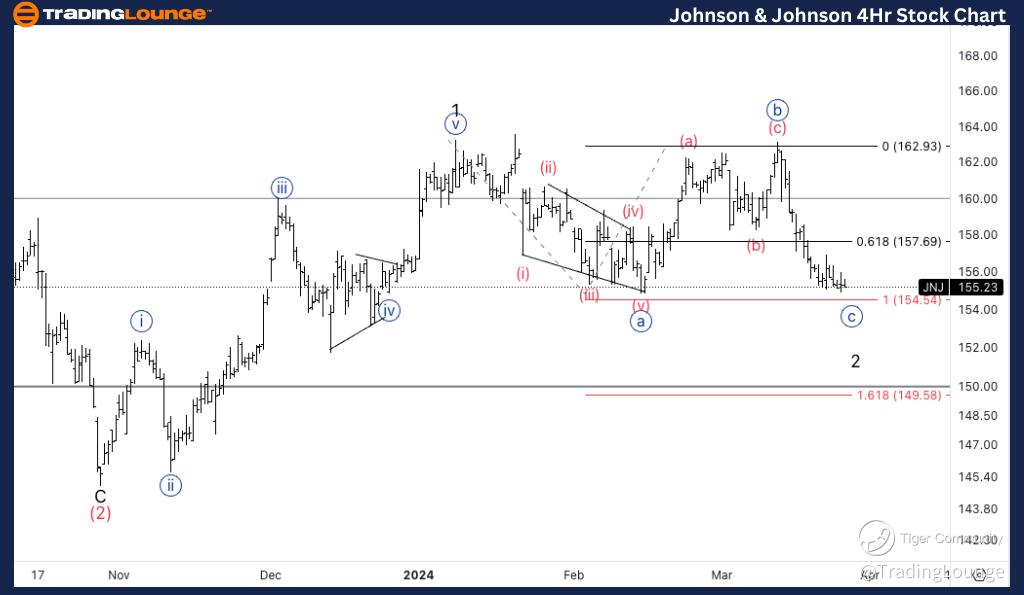
Johnson & Johnson, (JNJ) 4Hr Chart.
JNJ Elliott Wave Technical Analysis.
Function: Trend.
Mode: Impulsive.
Structure: Motive.
Position: Wave {c} of 2.
Direction: Turn into wave 3.
Details: Monitoring the downside into wave {c} as we are approaching equality of {c} vs. {a}. Looking for support to be found within the 155$ to 150$ range.
JNJ Elliott Wave technical analysis – Four-hour chart
Here, we observe a trending function marked by impulsive mode and motive structure, positioned in Wave {c} of 2. The direction indicates a transition into wave 3, with a focus on monitoring the downside into wave {c}. As we near equality between wave {c} and wave {a}, which typically occurs within the $155 to $150 range, we anticipate finding support.
Welcome to our JNJ Elliott Wave Analysis Trading Lounge, where we delve into Johnson & Johnson (JNJ) using Elliott Wave Technical Analysis. Let's explore the market dynamics on the Daily Chart as of March 26, 2024.
JNJ Elliott Wave technical analysis [Video]
Author

Peter Mathers
TradingLounge
Peter Mathers started actively trading in 1982. He began his career at Hoei and Shoin, a Japanese futures trading company.


