Johnson & Johnson (JNJ) is an American multinational corporation founded in 1886 that develops medical devices, pharmaceuticals, and consumer packaged goods. Its common stock is a component of the Dow Jones Industrial Average, and the company is ranked No. 36 on the 2021 Fortune 500 list of the largest United States corporations by total revenue.

JNJ Weekly Chart June 2024

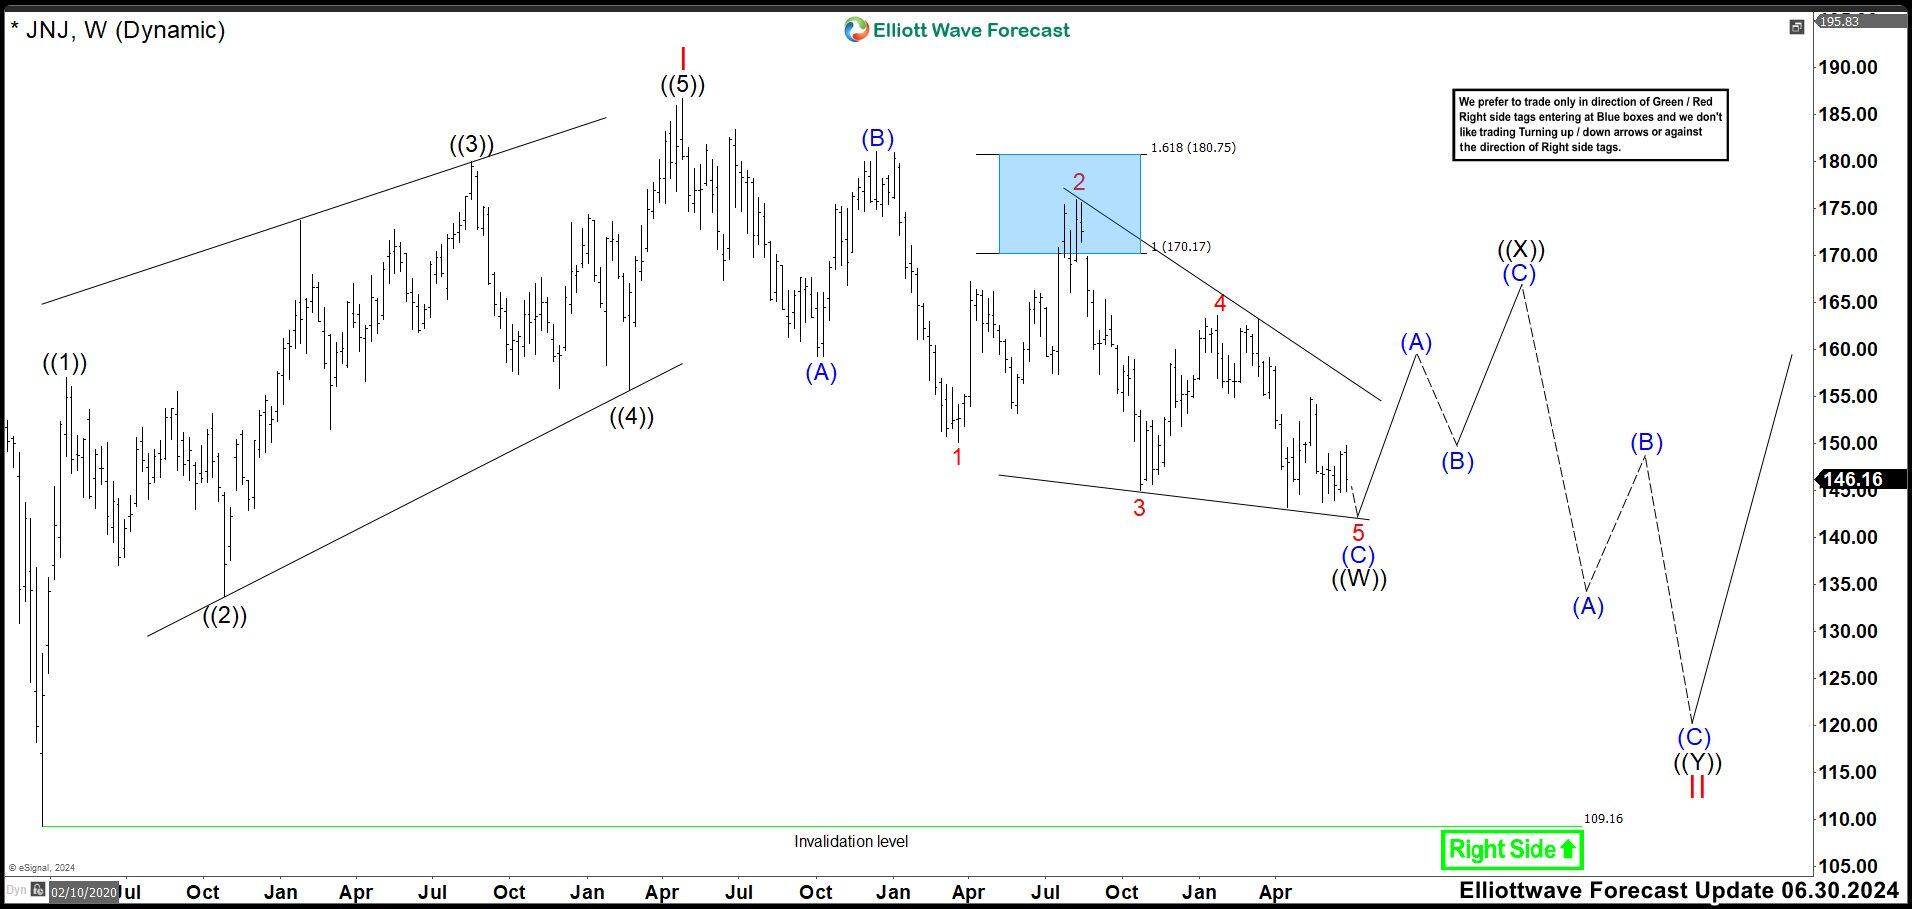
In the last analysis, we had adjusted the labelling of the structure from 186.69 high. Down from the peak. We labeled a flat correction as wave ((W)) where wave (C) was an ending diagonal. Wave (A) ended at 159.17 low in Oct 2022 and wave (B) rally finished at 181.04 high.  Then, the structure looked like as a double correction because we had a lot of waves traslaped. However, the momentum slowed down, suggesting that JNJ could be ready for a rally and the ending diagonal structure as wave (C) is the best option for this. (If you want to learn more about Elliott Wave Theory, please follow these links: Elliott Wave Education and Elliott Wave Theory).

JNJ Daily Chart June 2024

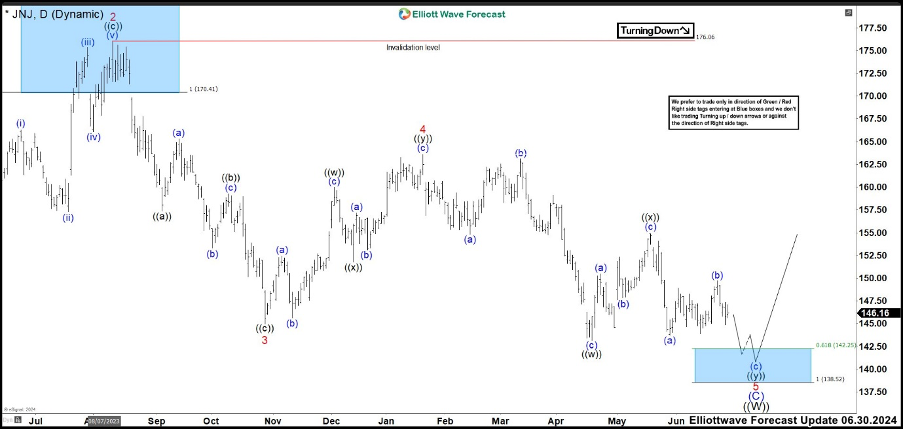
With a new Daily chart of JNJ, the price action broke below 144.95 wave 3 low, suggesting we are currently trading in wave 5 of (C). We said that, it was possible that wave 5 could be ended at 143.13 wave ((w)) low. However, we expected one more slighly low in 142. 25 – 138.52 area to end wave 5 of (C) and ((W)) as a double correction before resuming the rally.

JNJ Weekly Chart October 2024

Above we have last JNJ weekly chart updated. We can see the rally as expected ending wave (A) at 168.85 high and now it is pulling back in wave (B). As minimum we are looking for an (A), (B), (C) structure to complete wave ((X)) before resuming lower in wave ((Y)). However, we cannot rule out for now that JNJ breaks above wave I developing an impulse. If that happens, it is very possible that wave II could be completed.

JNJ Daily Chart October 2024

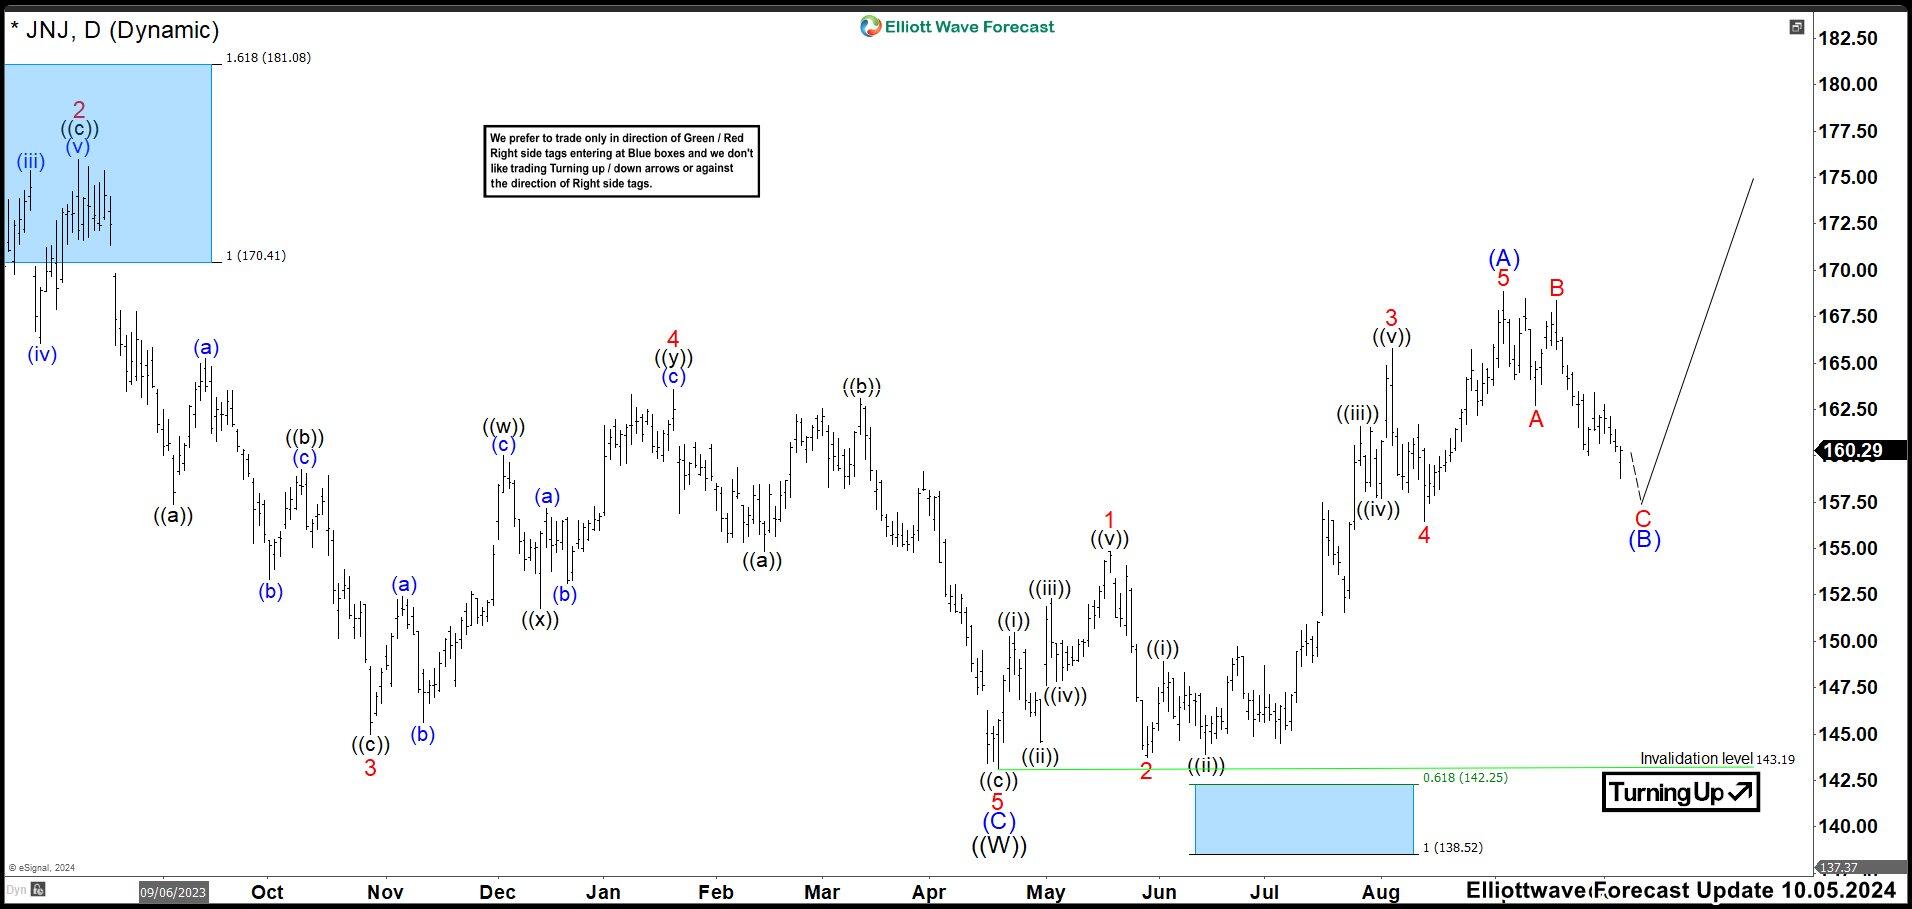
In the daily chart, we can see how the wave 5 end at 143.13 low developing a flat correction. Missing the slighly low to the bule box area. Wave ((W)) ended and the stock is bouncing in wave ((X)) correction. Wave (A) of ((X)) ended at 168.85 high and wave (B) is building a flat correction lower. The wave (B) could end in 155.87 – 152.82 area and then resume the rally in wave (C) of ((X)). So be it is not clear that JNJ is going to do an impulse or correction from 143.13 low, we prefer to remain bullish and look for buying opportunities.


Share: Feed news

FURTHER DISCLOSURES AND DISCLAIMER CONCERNING RISK, RESPONSIBILITY AND LIABILITY Trading in the Foreign Exchange market is a challenging opportunity where above average returns are available for educated and experienced investors who are willing to take above average risk. However, before deciding to participate in Foreign Exchange (FX) trading, you should carefully consider your investment objectives, level of xperience and risk appetite. Do not invest or trade capital you cannot afford to lose. EME PROCESSING AND CONSULTING, LLC, THEIR REPRESENTATIVES, AND ANYONE WORKING FOR OR WITHIN WWW.ELLIOTTWAVE- FORECAST.COM is not responsible for any loss from any form of distributed advice, signal, analysis, or content. Again, we fully DISCLOSE to the Subscriber base that the Service as a whole, the individual Parties, Representatives, or owners shall not be liable to any and all Subscribers for any losses or damages as a result of any action taken by the Subscriber from any trade idea or signal posted on the website(s) distributed through any form of social-media, email, the website, and/or any other electronic, written, verbal, or future form of communication . All analysis, trading signals, trading recommendations, all charts, communicated interpretations of the wave counts, and all content from any media form produced by www.Elliottwave-forecast.com and/or the Representatives are solely the opinions and best efforts of the respective author(s). In general Forex instruments are highly leveraged, and traders can lose some or all of their initial margin funds. All content provided by www.Elliottwave-forecast.com is expressed in good faith and is intended to help Subscribers succeed in the marketplace, but it is never guaranteed. There is no “holy grail” to trading or forecasting the market and we are wrong sometimes like everyone else. Please understand and accept the risk involved when making any trading and/or investment decision. UNDERSTAND that all the content we provide is protected through copyright of EME PROCESSING AND CONSULTING, LLC. It is illegal to disseminate in any form of communication any part or all of our proprietary information without specific authorization. UNDERSTAND that you also agree to not allow persons that are not PAID SUBSCRIBERS to view any of the content not released publicly. IF YOU ARE FOUND TO BE IN VIOLATION OF THESE RESTRICTIONS you or your firm (as the Subscriber) will be charged fully with no discount for one year subscription to our Premium Plus Plan at $1,799.88 for EACH person or firm who received any of our content illegally through the respected intermediary’s (Subscriber in violation of terms) channel(s) of communication.

Recommended content


Recommended content

Editors’ Picks

AUD/USD: Next on the downside emerges the 200-day SMA

AUD/USD: Next on the downside emerges the 200-day SMA

AUD/USD retreated for the third day in a row on Monday, breaking below the 0.6800 support with certain conviction amidst mild gains in the US Dollar and ahead of the release of the RBA Minutes early on Tuesday.

AUD/USD News
EUR/USD remained under pressure and below 1.1000

EUR/USD remained under pressure and below 1.1000

There was no respite for the leg lower in EUR/USD, although the steep pullback seems to have met some decent contention around 1.0950 for the time being, always against the backdrop of unabated gains in the Greenback and persevering geopolitical jitters.

EUR/USD News
Gold struggles as US yields rise, big rate cut hopes wane

Gold struggles as US yields rise, big rate cut hopes wane

Gold price edges down during Monday’s North American session, yet it remains within the $2,630 - $2,659 range as US Treasury bond yields capped the yellow metal advance, while the escalation of the Middle East conflict keeps the precious metal from falling further.

Gold News
Ethereum could see faster block times after new proposal, prices continue consolidating under $2,500

Ethereum could see faster block times after new proposal, prices continue consolidating under $2,500

Ethereum is up slightly by 0.1% on Monday following the appearance of a Doji candle, indicating a potential reversal in price trend. The potential price change follows a new Ethereum Improvement Proposal EIP-7781, which aims to reduce slot time and boost the network's speed by roughly 50%.

Read more
RBA widely expected to keep key interest rate unchanged amid persisting price pressures

RBA widely expected to keep key interest rate unchanged amid persisting price pressures

The Reserve Bank of Australia is likely to continue bucking the trend adopted by major central banks of the dovish policy pivot, opting to maintain the policy for the seventh consecutive meeting on Tuesday.

Read more
Five best Forex brokers in 2024

Five best Forex brokers in 2024

VERIFIED Choosing the best Forex broker in 2024 requires careful consideration of certain essential factors. With the wide array of options available, it is crucial to find a broker that aligns with your trading style, experience level, and financial goals. 

Read More

Forex MAJORS

Cryptocurrencies

Signatures