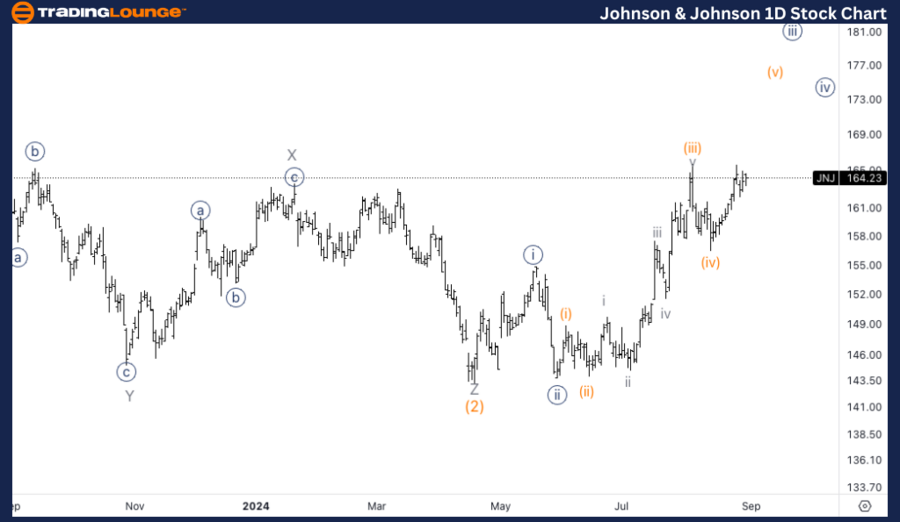
JNJ Elliott Wave Analysis Trading Lounge Daily Chart,

Johnson & Johnson, (JNJ) Daily Chart. 

JNJ Elliott Wave technical analysis

Function: Trend.

Mode: Impulsive.  

Structure: Motive. 

Structure: Wave {iii} of 1.    

Direction: Upside into wave 1.  

Details: Looking for a top in wave {iii} soon as the subdivision seems to have provided us with a five wave move within {iii}.

Chart

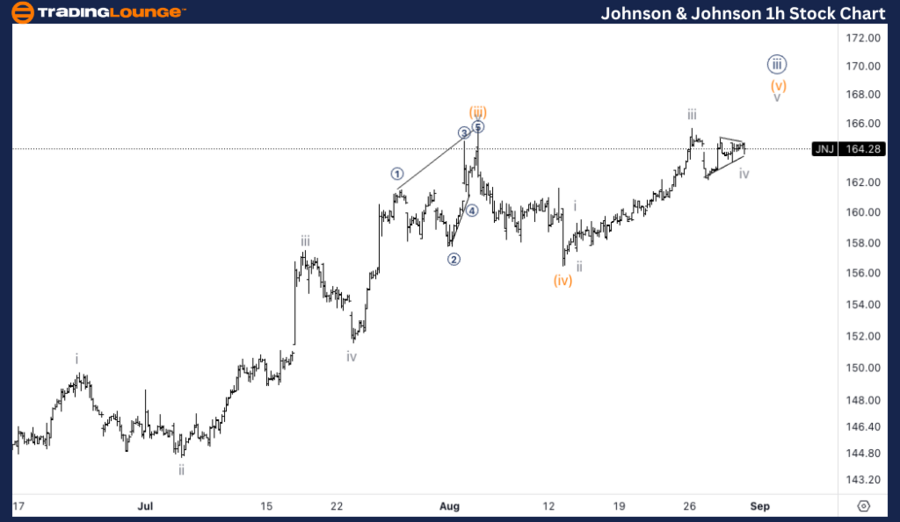
JNJ Elliott Wave Analysis Trading Lounge 1H Chart,

Johnson & Johnson, (JNJ) 1H Chart 

JNJ Elliott Wave technical analysis

Function: Trend. 

Mode: Impulsive.  

Structure:  Motive. 

Position: Wave (v) of {iii}.  

Direction: Upside in wave v of (v). 

Details: We seem to have a triangle in wave iv, which means we could see upside within wave v during today’s session, as it has also been developing just below 165$.

Chart

This Elliott Wave analysis for Johnson & Johnson (JNJ), provides insights into the stock's trend direction and potential price movements on both the daily and 1-hour charts. The analysis helps traders understand the market structure and potential trading opportunities.

JNJ Elliott Wave technical analysis – Daily chart

JNJ appears to be in the latter stages of wave {iii} of 1. The structure shows a five-wave subdivision within wave {iii}, indicating that the wave might be nearing its top. A completion of wave {iii} will likely be followed by a corrective wave {iv} before further upside in wave {v}. 

JNJ Elliott Wave technical analysis – One-hour chart 

The 1-hour chart suggests that JNJ is within wave (v) of {iii}. There appears to be a triangle pattern forming in wave iv, which typically indicates a consolidation before the final move upward. This pattern suggests that JNJ could see further upside in wave v of (v), potentially breaking above the 165$ level during today's trading session.

Technical analyst: Alessio Barretta.

JNJ Elliott Wave technical analysis [Video]

Share: Feed news

As with any investment opportunity there is a risk of making losses on investments that Trading Lounge expresses opinions on.

Historical results are no guarantee of future returns. Some investments are inherently riskier than others. At worst, you could lose your entire investment. TradingLounge™ uses a range of technical analysis tools, software and basic fundamental analysis as well as economic forecasts aimed at minimizing the potential for loss.

The advice we provide through our TradingLounge™ websites and our TradingLounge™ Membership has been prepared without considering your objectives, financial situation or needs. Reliance on such advice, information or data is at your own risk. The decision to trade and the method of trading is for you alone to decide. This information is of a general nature only, so you should, before acting upon any of the information or advice provided by us, consider the appropriateness of the advice considering your own objectives, financial situation or needs. Therefore, you should consult your financial advisor or accountant to determine whether trading in securities and derivatives products is appropriate for you considering your financial circumstances.

Recommended content


Recommended content

Editors’ Picks

How will US Dollar react to July PCE inflation data? – LIVE

How will US Dollar react to July PCE inflation data? – LIVE

The US Bureau of Economic Analysis will release the Personal Consumption Expenditures (PCE) Price Index, the Fed's preferred gauge f inflation, for July. Market expectations of the Fed rate outlook could be impacted by PCE inflation data, driving the USD's action.

FOLLOW US LIVE
EUR/USD stays below 1.1200 ahead of EU inflation data

EUR/USD stays below 1.1200 ahead of EU inflation data

EUR/USD struggles to gather recovery momentum and trades in a narrow channel below 1.1200 on Friday after the data from the Eurozone showed that the annual HICP inflation softened to 2.2% in August. Investors await PCE inflation figures from the US.

EUR/USD News
GBP/USD advances toward 1.3200 ahead of US PCE data

GBP/USD advances toward 1.3200 ahead of US PCE data

GBP/USD is gaining ground in the European trading hours on Friday, approaching 1.3200 as risk sentiment remains in a sweeter spot. Traders, however, could refrain from placing further bets on the pair ahead of the all-important US PCE inflation data. 

GBP/USD News
US core PCE inflation could help markets gauge how big will be Federal Reserve’s September rate cut

US core PCE inflation could help markets gauge how big will be Federal Reserve’s September rate cut

The United States (US) Bureau of Economic Analysis (BEA) will release the high-impact core Personal Consumption Expenditures (PCE) Price Index, the Federal Reserve’s (Fed) preferred inflation gauge, on Friday at 12:30 GMT.

Read more
US core PCE inflation could help markets gauge how big will be Federal Reserve’s September rate cut

US core PCE inflation could help markets gauge how big will be Federal Reserve’s September rate cut

The United States (US) Bureau of Economic Analysis (BEA) will release the high-impact core Personal Consumption Expenditures (PCE) Price Index, the Federal Reserve’s (Fed) preferred inflation gauge, on Friday at 12:30 GMT.

Read more
Moneta Markets review 2024: All you need to know

Moneta Markets review 2024: All you need to know

VERIFIED In this review, the FXStreet team provides an independent and thorough analysis based on direct testing and real experiences with Moneta Markets – an excellent broker for novice to intermediate forex traders who want to broaden their knowledge base.

Read More

Forex MAJORS

Cryptocurrencies

Signatures