JHX analysis and Elliott Wave forecast [Video]
![JHX analysis and Elliott Wave forecast [Video]](https://editorial.fxsstatic.com/images/i/General-Stocks_2_XtraLarge.png)
JAMES HARDIE INDUSTRIES PLC (JHX) Elliott Wave Technical Analysis.
Market outlook
Our Elliott Wave analysis updates the Australian Stock Exchange (ASX) with a focus on JAMES HARDIE INDUSTRIES PLC (JHX). The ASX:JHX shares are expected to decline further in the medium term. Long strategies should be considered cautiously, given the associated risk factors. This analysis highlights the potential trend and key price levels, offering both scientific and intuitive insights into market movements.
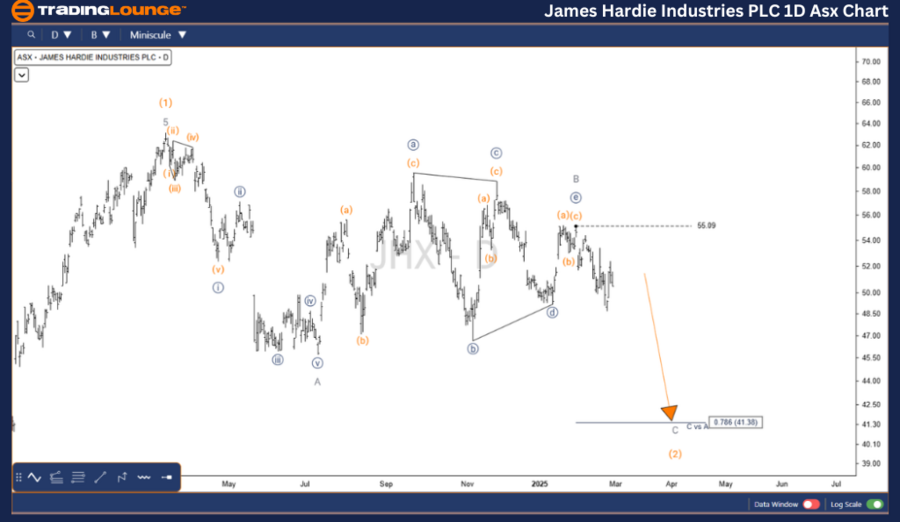
JAMES HARDIE INDUSTRIES PLC (JHX) Elliott Wave Technical Analysis.
1D Chart (Semilog Scale) Analysis.
-
Function: Major trend (Intermediate degree, Orange).
-
Mode: Motive.
-
Structure: Impulse.
-
Position: Wave C - Grey of Wave (2) - Orange.
Details:
Wave (2) - Orange appears incomplete and is evolving into a Zigzag pattern. The recent price movement shows a prolonged sideways trend, suggesting a Triangle labeled as wave B - Grey has recently concluded. This signals that Wave C - Grey is set to push lower, breaking the 49.16 USD level to further confirm this outlook.
-
Invalidation point: 55.09.
-
Key level: 49.16.
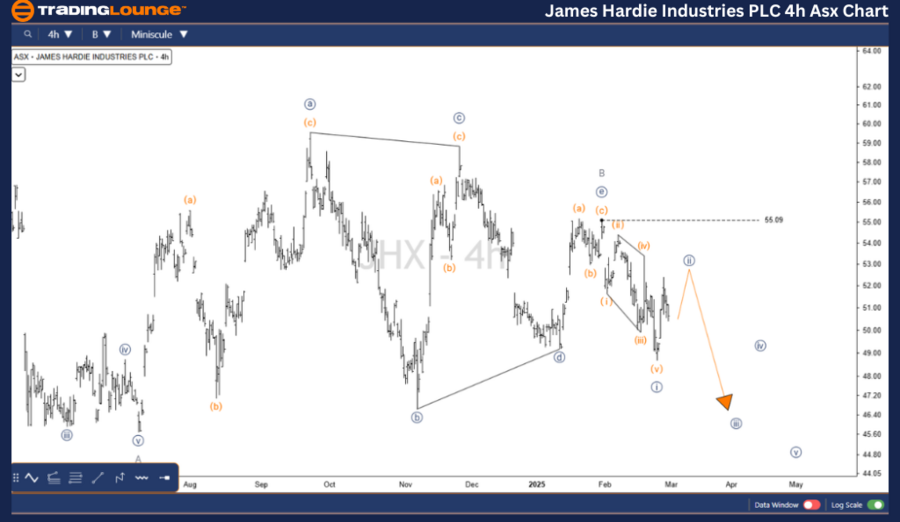
JAMES HARDIE INDUSTRIES PLC (JHX) Elliott Wave Technical Analysis.
Four-hour chart analysis
-
Function: Major trend (Intermediate degree, Orange).
-
Mode: Motive.
-
Structure: Impulse.
-
Position: Wave ((ii)) - Navy of Wave C - Grey of Wave (2) - Orange.
Details:
A closer look at the ((e)) - Navy wave of the B - Grey wave reveals a three-wave zigzag formation, which recently concluded at 55.09 USD. This aligns with a bearish outlook, increasing the likelihood of further declines.
-
Invalidation point: 55.09.
-
Key level: 49.16.
Conclusion
This analysis provides insights into JAMES HARDIE INDUSTRIES PLC (JHX) by identifying key price levels and contextual trends. Our wave count validation signals help enhance the accuracy of the forecast. By combining technical expertise with objective market analysis, we aim to equip traders with the most professional perspective on market movements.
Technical Analyst:
Hua (Shane) Cuong, CEWA-M (Master’s Designation).
JHX Elliott Wave technical analysis [Video]
Author

Peter Mathers
TradingLounge
Peter Mathers started actively trading in 1982. He began his career at Hoei and Shoin, a Japanese futures trading company.


