James Hardie Industries Plc analysis and Elliott Wave forecast [Video]
![James Hardie Industries Plc analysis and Elliott Wave forecast [Video]](https://editorial.fxsstatic.com/images/i/Economic-Indicator_Industrial-Production-2_XtraLarge.png)
JAMES HARDIE INDUSTRIES PLC (JHX) Elliott Wave Technical Analysis TradingLounge.
Our latest Elliott Wave analysis provides an updated outlook on JAMES HARDIE INDUSTRIES PLC (ASX: JHX), listed on the Australian Stock Exchange (ASX).
We observe bullish potential in ASX:JHX, indicating a strong probability of a significant upward move. Today’s detailed analysis will highlight key price levels that confirm the initiation of a bull market trend with Wave Three.
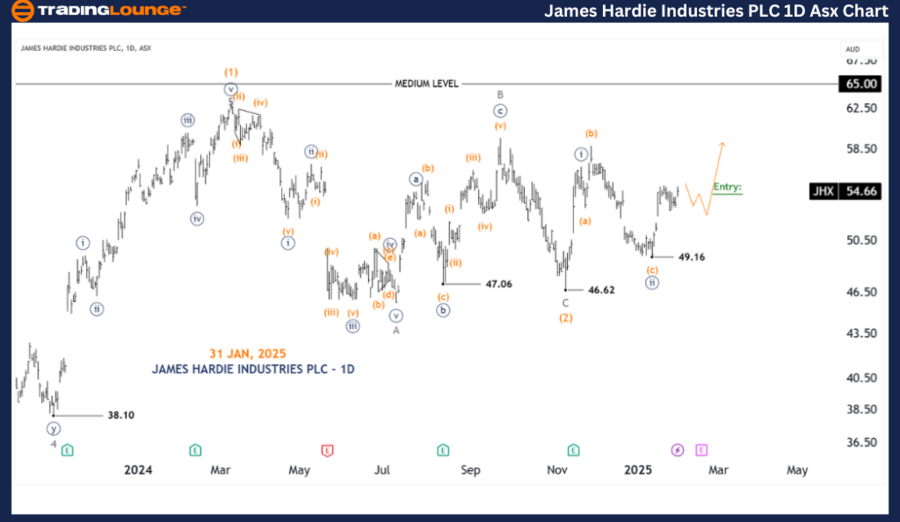
James Hardie Industries Plc (JHX) - One-day chart
Elliott Wave technical analysis
-
Function: Major trend (Intermediate degree, Orange).
-
Mode: Motive.
-
Structure: Impulse.
-
Position: Wave ((iii)) - Navy of Wave (2) - Orange.
Details:
-
Wave ((ii)) - Navy concluded as an Expanded Flat at the low of 46.16.
-
Wave ((iii)) - Navy is advancing higher.
-
We anticipate a minor pullback, presenting a potential buying opportunity before moving further upward.
Invalidation point: 49.16
James Hardie Industries Plc (JHX) four-hour chart analysis
Elliott Wave technical analysis
-
Function: Major trend (Minor degree, Grey).
-
Mode: Motive.
-
Structure: Impulse.
-
Position: Wave (ii) - Orange of Wave ((iii)) - Navy.
Details:
-
Observing price action from 49.16, it appears that Wave (i) - Orange has likely completed.
-
Currently, Wave (ii) - Orange is unfolding in an Expanded Flat pattern, expected to conclude soon.
-
Following completion, Wave (iii) - Orange is projected to continue the upward momentum.
Invalidation point: 49.16.
Key point: The end of Wave b - Grey.
.png.52b81a4f267e294a81ccd5c25c7f6b70.png)
Conclusion
Our technical outlook on JAMES HARDIE INDUSTRIES PLC (JHX) provides insights into current market trends and trading opportunities. By identifying critical price levels, we highlight key validation and invalidation signals to strengthen our Elliott Wave projections.
By integrating these factors, our goal is to deliver a comprehensive, professional, and objective market perspective, equipping traders with actionable insights for ASX:JHX.
James Hardie Industries Plc analysis and Elliott Wave forecast [Video]
Author

Peter Mathers
TradingLounge
Peter Mathers started actively trading in 1982. He began his career at Hoei and Shoin, a Japanese futures trading company.


