ITC Ltd – Indian stocks Elliott Wave technical analysis [Video]
![ITC Ltd – Indian stocks Elliott Wave technical analysis [Video]](https://editorial.fxstreet.com/images/TechnicalAnalysis/ChartPatterns/Chartism/stock-market-ticker-board-black-17803444_XtraLarge.jpg)
ITC Ltd Elliott Wave technical analysis
Function: Counter Trend (Minor degree, Grey).
Mode: Corrective.
Structure: Larger degree zigzag.
Position: Minor Wave 3 Grey.
Details: Minor Wave 3 could be underway lower against 530 mark.
Invalidation point: 530.
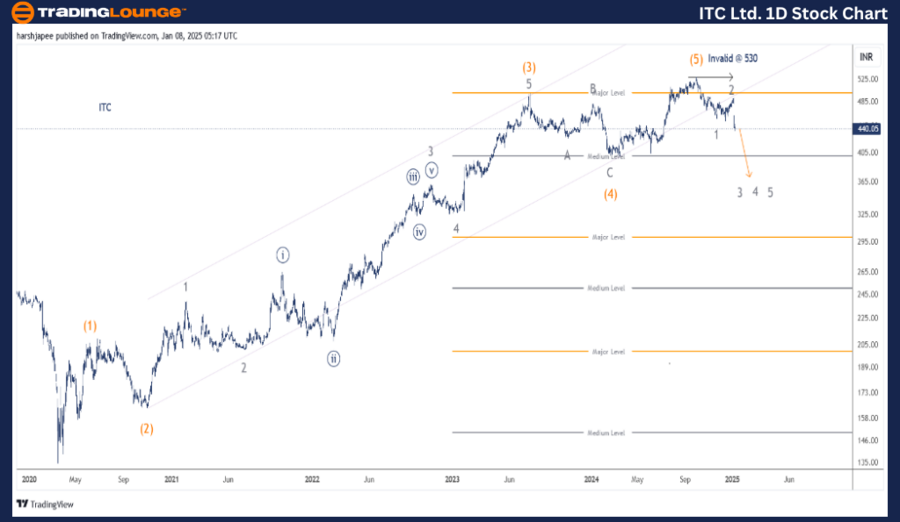
ITC daily chart technical analysis and potential Elliott Wave counts
ITC daily chart is indicating a potential trend reversal underway after hitting 530 high in October 2024. The stock has slipped through 445 levels now, after carving Minor Waves 1 and 2 around 455 and 490 levels respectively.
The stock had dropped through 134 lows in March 2020 as seen on the daily chart. Intermediate Wave (1) Orange unfolded as a potential leading diagonal terminating around 209 mark. Wave (2) slipped through 164 while Wave (3) was an extension pushing through 498 high.
The stock has reversed sharply after Intermediate Wave (5) termination around 530 mark. At the time of writing, it is unfolding Minor Wave 3 and is targeting 394 lows medium term.
ITC Ltd Elliott Wave technical analysis
Function: Counter Trend (Minor degree, Grey).
Mode: Corrective.
Structure: Larger degree zigzag.
Position: Minor Wave 3 Grey.
Details: Minor Wave 3 could be underway lower against 530 mark as Minor Wave 2 unfolded as an expanded flat terminating around 490-500 range.
Invalidation point: 530.
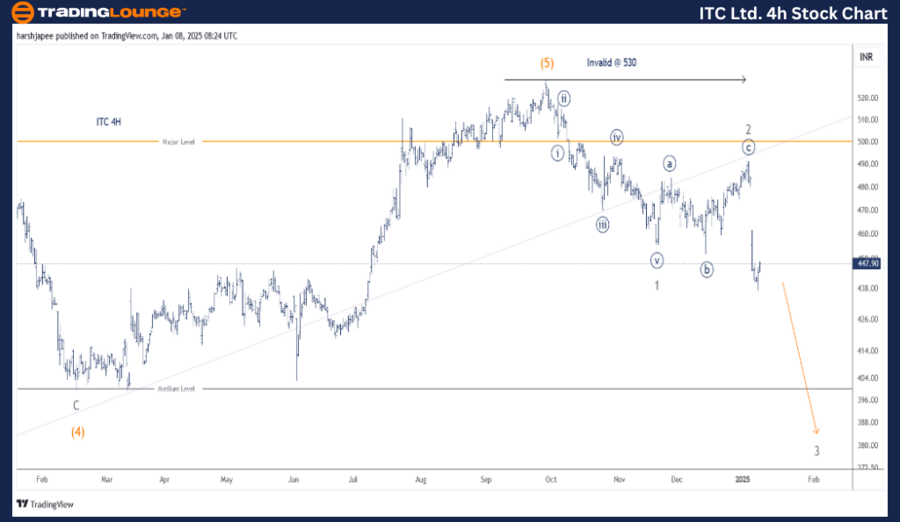
ITC four-hour chart technical analysis and potential Elliott Wave counts
ITC 4H chart is highlighting the sub waves post Intermediate Wave (4) Orange termination around 400 levels in March 2024. The rally to terminate Intermediate Wave (5) around 530 was an impulse, which has been followed by a sharp trend reversal.
The stock has carved Minor Wave 1 around 455 levels, followed by an expanded flat Wave 2 termination around 490-500 range. The stock is trading around 447 mark at the time of writing, unfolding Minor Wave 3 Grey.
Conclusion
ITC is progressing lower within Minor Wave 3 against 530 high.
ITC Ltd – Indian stocks Elliott Wave technical analysis [Video]
Author

Peter Mathers
TradingLounge
Peter Mathers started actively trading in 1982. He began his career at Hoei and Shoin, a Japanese futures trading company.


