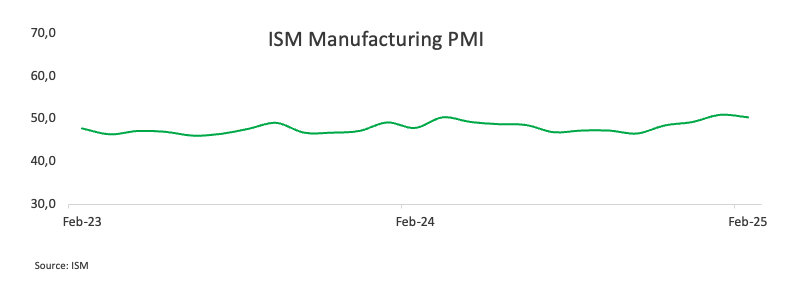
- The US ISM Manufacturing PMI missed consensus in February.
- The US Dollar remains well on the defensive on Monday.
Data from the Institute for Supply Management (ISM) show the Manufacturing PMI receding to 50.3 in February, down from 50.9 in the previous month and falling behind analysts’ forecasts of 50.5.
Meanwhile, the Prices Paid Index—which tracks inflation—advanced to 62.4 from 54.9, the Employment Index ticked lower to 47.6 from 50.3, and the New Orders Index deflated to 48.6, from 55.1.
Market reaction
The Greenback maintains its downbeat performance at the beginning of the week, motivating the US Dollar Index (DXY) to deflate to the 106.60 region.
US Dollar PRICE Today
The table below shows the percentage change of US Dollar (USD) against listed major currencies today. US Dollar was the strongest against the Japanese Yen.
| USD | EUR | GBP | JPY | CAD | AUD | NZD | CHF | |
|---|---|---|---|---|---|---|---|---|
| USD | -1.11% | -0.94% | -0.12% | -0.25% | -0.58% | -0.51% | -0.56% | |
| EUR | 1.11% | 0.06% | 0.77% | 0.68% | 0.44% | 0.41% | 0.35% | |
| GBP | 0.94% | -0.06% | 0.82% | 0.62% | 0.38% | 0.35% | 0.29% | |
| JPY | 0.12% | -0.77% | -0.82% | 0.08% | -0.41% | -0.36% | -0.48% | |
| CAD | 0.25% | -0.68% | -0.62% | -0.08% | -0.17% | -0.26% | -0.33% | |
| AUD | 0.58% | -0.44% | -0.38% | 0.41% | 0.17% | -0.02% | -0.09% | |
| NZD | 0.51% | -0.41% | -0.35% | 0.36% | 0.26% | 0.02% | -0.07% | |
| CHF | 0.56% | -0.35% | -0.29% | 0.48% | 0.33% | 0.09% | 0.07% |
The heat map shows percentage changes of major currencies against each other. The base currency is picked from the left column, while the quote currency is picked from the top row. For example, if you pick the US Dollar from the left column and move along the horizontal line to the Japanese Yen, the percentage change displayed in the box will represent USD (base)/JPY (quote).
This section below was published as a preview of the US ISM Manufacturing report for January at 09:00 GMT.
- The US ISM Manufacturing PMI is expected to tick a tad lower in February.
- Investors will also follow the ISM Prices index and the Employment index.
- EUR/USD came under pressure and broke below the 1.0400 level.
Anticipation is mounting as the Institute for Supply Management (ISM) gears up to unveil the February United States (US) Manufacturing Purchasing Managers’ Index (PMI) this Monday. This crucial report serves as a vital indicator of the health of the US manufacturing sector, while also offering a window into the broader economic outlook.
Key points to keep in mind:
- PMI benchmarks: A reading above 50.0 signals an expanding manufacturing sector, whereas a value below 50.0 indicates contraction.
- Analyst predictions: Experts are forecasting a February PMI of 50.8, marginally below January’s 50.9. Following this slight downtick, the index is still expected to remain within the expansion zone.
- Economic resilience under pressure: It’s worth noting that while the manufacturing sector showed signs of expansion, the health of the overall economy has been put to the test amid some loss of momentum in key fundamentals in past weeks, pouring cold water over the economic "exceptionalism" of the US.
This report not only reflects the pulse of the manufacturing area but also hints at the evolving narrative of the wider economy.
What to expect from the ISM manufacturing PMI report?
In January, the manufacturing sector continued its upward momentum for the third straight month, fueled by improvements in the ISM Manufacturing PMI. Several key components contributed to this optimistic picture:
New Orders surge: The New Orders Index continued to climb, signaling that manufacturers are receiving an increasing number of orders.
Production rebound: The Production Index bounced back into expansion territory for the first time since April 2024, indicating that factories have ramped up their output.
Rising costs: The Prices Index continued its upward trend in January—the fourth straight month of rising prices—likely reflecting buyers locking in and deploying their pricing strategies for 2025.
Backlog of orders: The numbers dipped slightly—from 45.9 in December to 44.9 in January, marking a 1 percentage point decrease. This continues a trend, marking the 28th month in a row where order backlogs have fallen, with none of the six largest manufacturing sectors seeing an increase in their order books in January 2025.
Employment gain: After contracting for 14 of the past 16 months, the Employment Index rebounded in January, climbing to 50.3 and signaling a return to expansion.
Generally, a PMI reading above 50 percent indicates that the manufacturing sector is growing, while a reading below 50 percent signals contraction. However, even levels above 42.5 percent over time can point to broader economic expansion.
Overall, the strength in manufacturing could boost high-yield assets like stocks, as investors become more optimistic about growth prospects. Meanwhile, the US Dollar (USD) might experience selling pressure as market confidence grows and investors shift toward riskier assets. Additionally, indicators such as rising new orders and easing price pressures are positive signs that could further propel economic expansion.
When will the ISM Manufacturing PMI report be released and how could it affect EUR/USD?
The ISM Manufacturing PMI report is scheduled for release at 15:00 GMT on Monday. Ahead of the data release, EUR/USD accelerated its bearish tone and slipped back to the 1.0380 zone to print new two-week lows, and is showing some difficulty in returning to the area beyond the 1.0400 barrier on a sustained basis.
Pablo Piovano, Senior Analyst at FXStreet, explained that the continued downward trend is likely to steer EUR/USD back toward its 2025 low of 1.0176, which was set on January 13. He mentioned that if this level breaks down further, it could signal a bearish turn, pushing the pair back to the critical parity zone.
Piovano also noted that on the upside, the pair faces a bit of resistance at the 2025 high of 1.0532 recorded on January 27. If the pair manages to break through this barrier, traders might see it surge toward the December 2024 top of 1.0629, especially once the Fibonacci retracement level of the September-January decline at 1.0572 is cleared.
Piovano added that the negative outlook is likely to persist as long as the spot trades below its key 200-day SMA at 1.0729.
He also pointed out that the Relative Strength Index (RSI) dropped to around 47, indicating a pick-up in the bearish stance, while the Average Directional Index (ADX) below 13 suggests that the current trend is weakening.
Fed FAQs
Monetary policy in the US is shaped by the Federal Reserve (Fed). The Fed has two mandates: to achieve price stability and foster full employment. Its primary tool to achieve these goals is by adjusting interest rates. When prices are rising too quickly and inflation is above the Fed’s 2% target, it raises interest rates, increasing borrowing costs throughout the economy. This results in a stronger US Dollar (USD) as it makes the US a more attractive place for international investors to park their money. When inflation falls below 2% or the Unemployment Rate is too high, the Fed may lower interest rates to encourage borrowing, which weighs on the Greenback.
The Federal Reserve (Fed) holds eight policy meetings a year, where the Federal Open Market Committee (FOMC) assesses economic conditions and makes monetary policy decisions. The FOMC is attended by twelve Fed officials – the seven members of the Board of Governors, the president of the Federal Reserve Bank of New York, and four of the remaining eleven regional Reserve Bank presidents, who serve one-year terms on a rotating basis.
In extreme situations, the Federal Reserve may resort to a policy named Quantitative Easing (QE). QE is the process by which the Fed substantially increases the flow of credit in a stuck financial system. It is a non-standard policy measure used during crises or when inflation is extremely low. It was the Fed’s weapon of choice during the Great Financial Crisis in 2008. It involves the Fed printing more Dollars and using them to buy high grade bonds from financial institutions. QE usually weakens the US Dollar.
Quantitative tightening (QT) is the reverse process of QE, whereby the Federal Reserve stops buying bonds from financial institutions and does not reinvest the principal from the bonds it holds maturing, to purchase new bonds. It is usually positive for the value of the US Dollar.
Economic Indicator
ISM Manufacturing Employment Index
The Institute for Supply Management (ISM) Manufacturing Index shows business conditions in the US manufacturing sector, taking into account expectations for future production, new orders, inventories, employment and deliveries. It is a significant indicator of the overall economic condition in US. The ISM Manufacturing Employment Index represents business sentiment regarding labor market conditions and is considered a strong Non-Farm Payrolls leading indicator. A high reading is seen as positive for the USD, while a low reading is seen as negative.
Read more.Last release: Mon Feb 03, 2025 15:00
Frequency: Monthly
Actual: 50.3
Consensus: -
Previous: 45.3
Source: Institute for Supply Management
Information on these pages contains forward-looking statements that involve risks and uncertainties. Markets and instruments profiled on this page are for informational purposes only and should not in any way come across as a recommendation to buy or sell in these assets. You should do your own thorough research before making any investment decisions. FXStreet does not in any way guarantee that this information is free from mistakes, errors, or material misstatements. It also does not guarantee that this information is of a timely nature. Investing in Open Markets involves a great deal of risk, including the loss of all or a portion of your investment, as well as emotional distress. All risks, losses and costs associated with investing, including total loss of principal, are your responsibility. The views and opinions expressed in this article are those of the authors and do not necessarily reflect the official policy or position of FXStreet nor its advertisers. The author will not be held responsible for information that is found at the end of links posted on this page.
If not otherwise explicitly mentioned in the body of the article, at the time of writing, the author has no position in any stock mentioned in this article and no business relationship with any company mentioned. The author has not received compensation for writing this article, other than from FXStreet.
FXStreet and the author do not provide personalized recommendations. The author makes no representations as to the accuracy, completeness, or suitability of this information. FXStreet and the author will not be liable for any errors, omissions or any losses, injuries or damages arising from this information and its display or use. Errors and omissions excepted.
The author and FXStreet are not registered investment advisors and nothing in this article is intended to be investment advice.


Recommended content
Editors’ Picks

EUR/USD remains depressed near 1.1350
The US Dollar now grabs momentum and motivates EUR/USD to return to the 1.1350 zone on Thursday, as investors continue to digest the ECB’s decision to lower its policy rates by 25 basis points, as widely estimated. It is worth noting that most markets will be closed on April 18, Good Friday.

GBP/USD maintains the consolidation around 1.3260
The upside momentum in the British pound remains well and sound on Thursday, underpinning the eighth consecutive daily advance in GBP/USD, which now trades in a consolidative fashion near 1.326. Cable’s strong performance comes despite the marked rebound in the US Dollar.

Gold bounces off daily lows, back near $3,320
The prevailing risk-on mood among traders challenges the metal’s recent gains and prompts a modest knee-jerk in its prices on Thursday. After bottoming out near the $3,280 zone per troy ounce, Gold prices are now reclaiming the $3,320 zone in spite of the stronger Greenback.

Crypto market cap fell more than 18% in Q1, wiping out $633.5 billion after Trump’s inauguration top
CoinGecko’s Q1 Crypto Industry Report highlights that the total crypto market capitalization fell by 18.6% in the first quarter, wiping out $633.5 billion after topping on January 18, just a couple of days ahead of US President Donald Trump’s inauguration.

Future-proofing portfolios: A playbook for tariff and recession risks
It does seem like we will be talking tariffs for a while. And if tariffs stay — in some shape or form — even after negotiations, we’ll likely be talking about recession too. Higher input costs, persistent inflation, and tighter monetary policy are already weighing on global growth.

The Best brokers to trade EUR/USD
SPONSORED Discover the top brokers for trading EUR/USD in 2025. Our list features brokers with competitive spreads, fast execution, and powerful platforms. Whether you're a beginner or an expert, find the right partner to navigate the dynamic Forex market.