Ishares Russell ETF, IWM Elliott Wave analysis shows bullish bias
Hello traders. Welcome to another blog post where we discuss the application of the Elliott wave theory to trade different financial assets. In today’s post, we will discuss the IWM Elliott wave analysis.
The ETF reached an all-time high in November 2021 at 244.46, completing a bullish cycle. Afterward, it plummeted to 162.78 in June 2022 as part of the bearish corrective phase. We shared the chart below with members of ElliottWave-Forecast on the weekend of 9th June 2024.
IWM Elliott Wave analysis – Weekly chart 06.09.2024
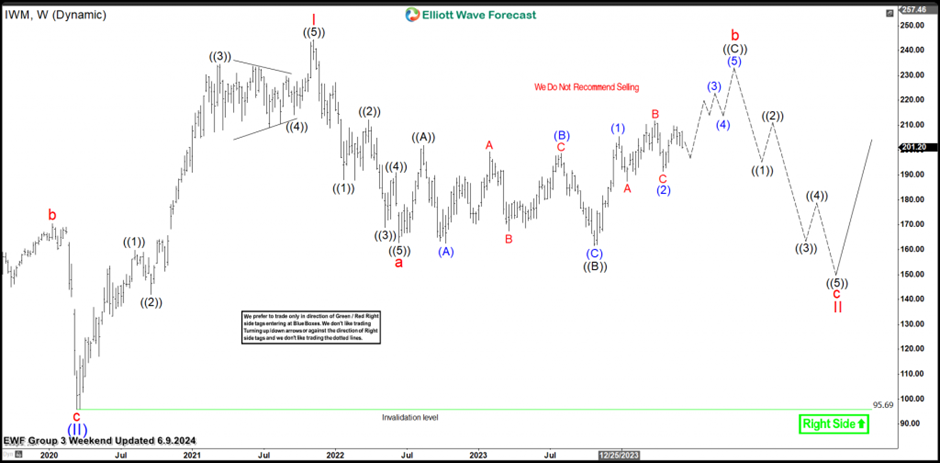
The weekly chart above shows the expected corrective phase – wave II. Wave II completed the first leg – wave a in June 2022 and is now on a multi-month rebound for the second leg – wave b. Meanwhile, the price is precisely moving upwards in wave (3) of ((C)) of b. We continued to share weekend charts with members, indicating that the preferred path was upward and we didn’t recommend selling. Thus, buying the pullback was ideal to align with the overriding trend.
IWM Elliott Wave analysis – H4 chart 06.10.2024
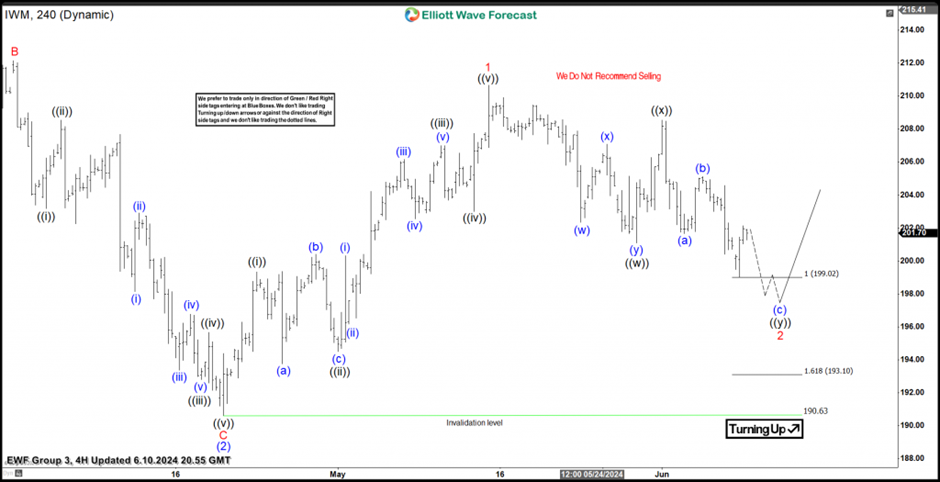
On 10th June 2024, we shared the chart above with members. We identified the end of wave 1 of (3) discussed above in the weekly chart. The corresponding pullback for wave 2 was completing a double zigzag Elliott Wave structure. Besides the structure, we also identified the reversal zone at 199.02-193.10. We expected wave 3 to begin from this zone, offering ample opportunity for buyers.
IWM Elliott Wave analysis – H4 chart 06.12.2024
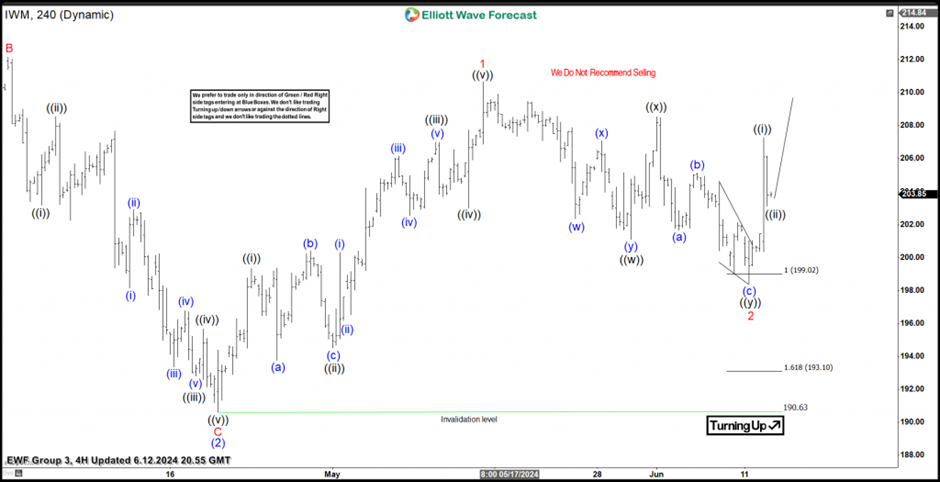
On 10th June 2024, the price hit a little below 199.02 and surged as expected. We shared the H4 chart above with members on 12th June to show wave 3 of (3) had begun. At the first surge, traders hit their first target, closed half of their positions, and adjusted the remaining half to almost break even. Thus, it’s a risk-free trade with the potential for even more profit.
What next?
Currently, IWM is in wave 3. Wave 3 should break above wave 1 with an impulse, targeting 223.85-228.19. However, we don’t expect the wave 3 rally to proceed in a straight line. There will be pullbacks along the way. The good thing is that these pullbacks can be trading opportunities on the hourly time frames. We update the H1 chart of the IWM three times a day, the H4 chart at the end of the day, and the Daily and Weekly charts on the weekend. We do this consistently for IWM and 77 other instruments.
Members receive hourly updates four times a day and can use our forecasts as guides for their trading strategies. On each chart, we indicate the trading direction to consider. In the live trading room, members have access to trade signals and trade management guides. Additionally, members can chat with our analysts 24 hours from Monday to Friday.
Author

Elliott Wave Forecast Team
ElliottWave-Forecast.com


