Is the uptrend in stocks overextended?

The Friday session started with a slight advance, but stock prices steadily climbed, closing 0.8% higher. The S&P 500 index broke the previous Friday's record, reaching a level of 5,140.33. On Friday, I wrote about February, “Despite concerns about stock valuations, the market rallied to new record highs, fueled by hopes of the Fed's monetary policy pivot and the AI revolution.”. And yet, it was the same story again on the first trading day of March.
However, there is growing uncertainty recentlya. While indexes are hitting new record highs, most stocks are essentially moving sideways. So, the question is – is this just a pause within an uptrend or some topping pattern before a more meaningful correction? Still, there have been no confirmed negative signals; however, one might consider the possibility of a trend reversal.
Recently, the stock market continued to rally, fueled by advances in a handful of tech sector stocks, but as I wrote on February 7, “We may have to deal with a correction or consolidation of several weeks of advances. With the season of quarterly earnings announcements coming to an end and a series of important economic data, profit taking may follow.” Despite Friday's rally, this still holds true. Nevertheless, such volatility complicates short-term market predictions.
This morning, the S&P 500 futures contract is trading 0.2% lower, indicating a slightly lower opening for the index. The market is expected to retrace some of Friday's rally; however, it appears it will remain above the 5,100 level.
The investor sentiment has improved again; last Wednesday’s AAII Investor Sentiment Survey showed that 46.5% of individual investors are bullish, while only 21.3% of them are bearish. The AAII sentiment is a contrary indicator in the sense that highly bullish readings may suggest excessive complacency and a lack of fear in the market. Conversely, bearish readings are favorable for market upturns.
The S&P 500 index broke above the recent trading range, and the short-term resistance level of 5,100, as we can see on the daily chart.
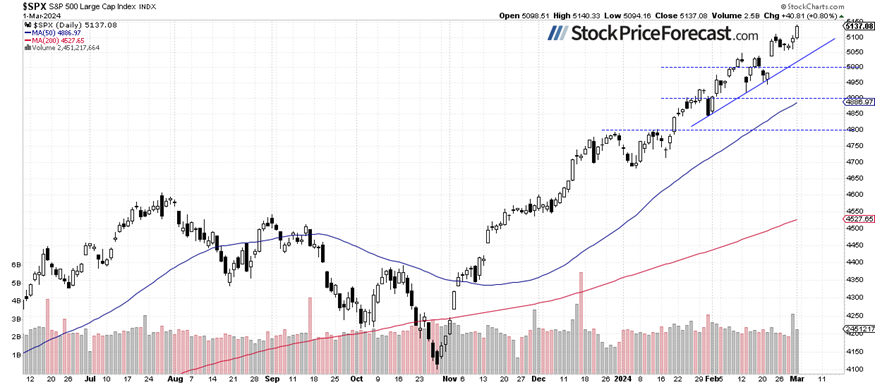
S&P 500 gained almost 1% last week
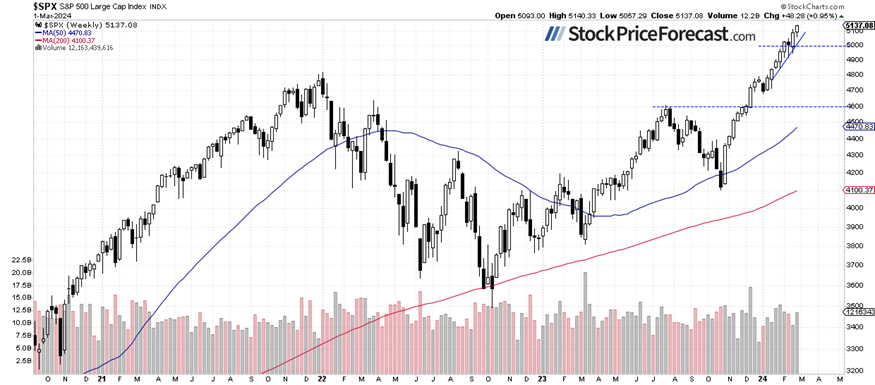
Compared to the previous Friday’s closing price, the index gained 0.95%. It wasn’t much, considering the very bullish sentiment, and that most of the advance was made on Friday. Nevertheless, the market extended its uptrend even further above the 5,000 level. It looks more and more overbought, however, no clearly negative signals are evident yet.
Nasdaq 100 rallied above 18,000
On Friday, the technology-focused Nasdaq 100 index accelerated the uptrend after breaking above the 18,000 level, marked by seven of the recent daily highs. It was relatively stronger than the broad stock market, gaining 1.44%. The Nasdaq’s bull run was led by Nvidia, and today, this stock poised to break another record, gaining more than 2% in the pre-market trading.

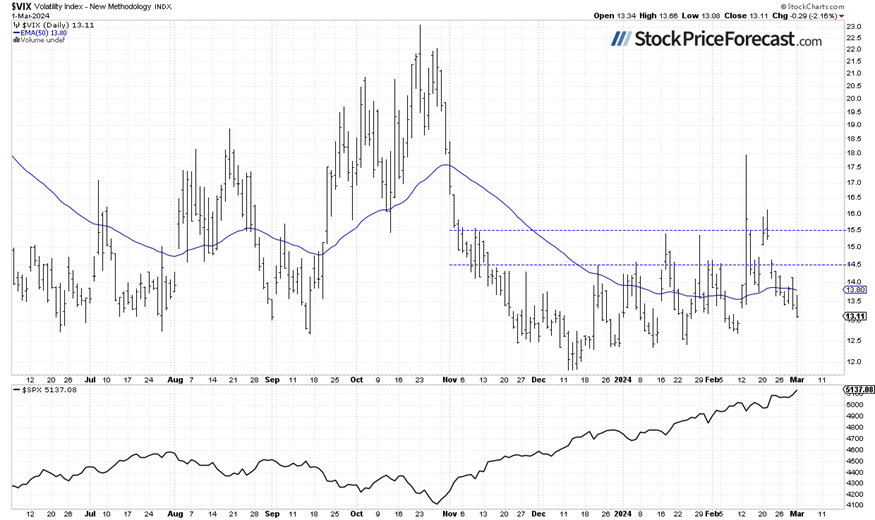
VIX – Getting closer to 13
The VIX index, also known as the fear gauge, is derived from option prices. Stock prices rallied on Friday, leading the VIX lower as it approached the 13 level. It’s getting closer to its previous lows, indicating a growing complacency in the market.
Historically, a dropping VIX indicates less fear in the market, and rising VIX accompanies stock market downturns. However, the lower the VIX, the higher the probability of the market’s downward reversal.
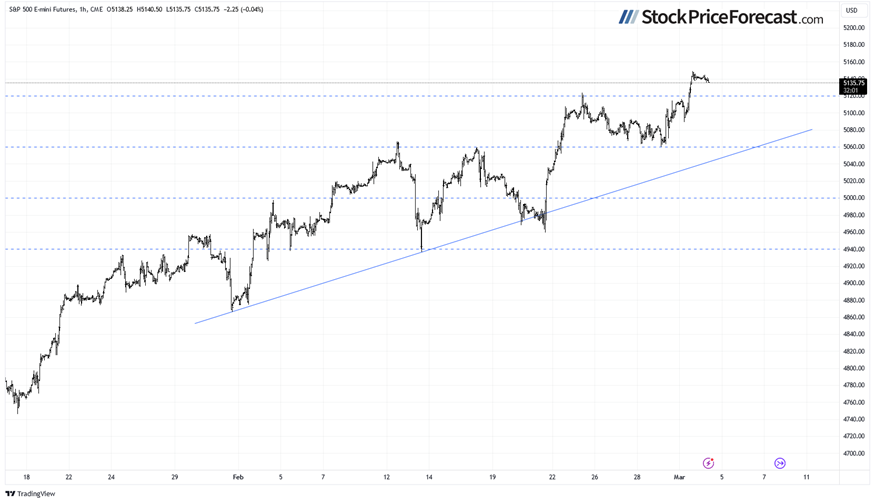
Futures contract going sideways
Let’s take a look at the hourly chart of the S&P 500 futures contract. On Friday, it reached a new record high of around 5,149, and this morning, it’s trading around 5,140. The support level is now at 5,100-5,120.
Conclusion
The recent trading action was very bullish, with some of the tech stocks rallying to new record highs, the S&P 500 index breaking above 5,100, and the Nasdaq 100 index testing the 18,000 mark. In my February 13 analysis, I noted that, “in the short term, the possibility of a downward correction cannot be overlooked. A quick glance at the chart reveals that the S&P 500 index has recently become more volatile.”. Indeed, the correction occurred pretty fast, with the inflation number contributing to the downturn. However, the market quickly retraced the decline in the following days, and then rallied, led by Nvidia stock after its earnings release.
Today, the S&P 500 is likely to open slightly lower, retracing a part of its Friday’s record-breaking rally. The most likely scenario is an extended consolidation at some point, as not all stocks are participating in the rally, and it's driven by a handful of AI-connected ones.
On Friday, I noted in my Stock Price Forecast for March, “So far, stock prices have been trending upwards in the medium to long term, reaching new record highs. The prudent advice one could give right now is to remain bullish or stay on the sidelines if one believes stocks are becoming overvalued and may need a correction. It's likely that the S&P 500 will continue its bull run this month. However, we may encounter a correction or increased volatility at some point as investors start to take profits off the table.”
For now, my short-term outlook remains neutral.
Here’s the breakdown:
-
The S&P 500 extended its record-breaking rally last week, and today, it’s likely to open slightly lower.
-
A longer consolidation phase may ensue, following an extended rally over the past months.
-
In my opinion, the short-term outlook is neutral.
The full version of today’s analysis - today’s Stock Trading Alert - is bigger than what you read above, and it includes the additional analysis of the Apple (AAPL) stock and the current S&P 500 futures contract position. I encourage you to subscribe and read the details today. Stocks Trading Alerts are also a part of our Diamond Package that includes Gold Trading Alerts and Oil Trading Alerts.
And if you’re not yet on our free mailing list, I strongly encourage you to join it - you’ll stay up-to-date with our free analyses that will still put you ahead of 99% of investors that don’t have access to this information. Join our free stock newsletter today.
Want free follow-ups to the above article and details not available to 99%+ investors? Sign up to our free newsletter today!
Want free follow-ups to the above article and details not available to 99%+ investors? Sign up to our free newsletter today!
Author

Paul Rejczak
Sunshine Profits
Paul Rejczak is a stock market strategist who has been known for the quality of his technical and fundamental analysis since the late nineties.


