Is the S&P500 in a bear market?

Yesterday’s “Liberation Day” took the market hostage today as the Trump Administration introduced counter-tariffs that were higher than expected. People are “terrified”- pun intended. However, while one should never succumb to the prevailing sentiment of the day, many are rightfully questioning whether a new bear market has begun. Here, we present one indicator that can help answer that question: the New 52-Week Lows (NYLOW). See Figure 1 below.
Figure 1
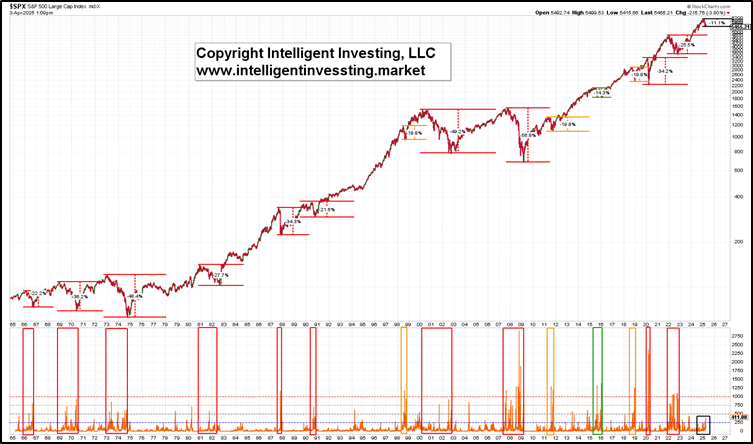
Since 1965, when NYLOW data became available, we have identified ten bear markets for the S&P 500 (SPX), defined as price declines exceeding 20% that last more than two months from peak to trough. We included three declines of nearly 20% in this analysis but excluded one decline of 14.3%. Although it lasted almost eight months and saw NYLOW spikes above 1000, it did not meet the percentage criteria. The current decline is approximately 11%, on a closing basis, and has persisted for around seven weeks so far. Here is what we found:
- In all 13 cases, the NYLOW spiked above 500.
- In 11 instances, the NYLOW spiked above 750.
- In 7 bear markets, the NYLOW spiked above 1000.
Red and orange boxes highlight these occasions. So, what does this imply for the current market? You need to look closely to spot the tiny black box in the far lower right corner of the chart. This year, NYLOW has thus far spiked to 289 and 276 and currently stands at 411 today. The latter is more akin to the 10.5% correction from August to October in 2023.
Therefore, the available data indicates that no new bear market is underway.
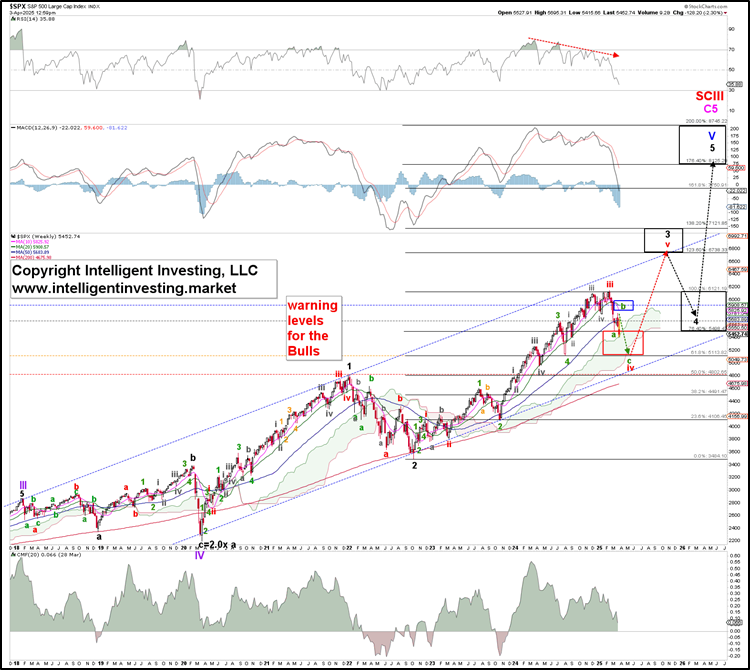
Where does that leave us? In our previous update, we demonstrated through the Elliott Wave that the S&P 500 was likely in a prolonged fourth wave based on a standard Fibonacci impulse pattern. This analysis assumes that the rally from the COVID-19 low in March 2020 to the high reached in 2021 constituted Wave 1, while the 2022 bear market represented Wave 2. The index should now be in a subdividing W-3. See Figure 2 below.
Figure 2
The day after the index bottomed out, we found,
“If the index stalls at around $ 5,900 ± 100 and then drops below this week’s low, [$ 5,504], … , we expect the SPX to target the 61.8% extension at $ 5,116 before the red W-v to $ 7122-7746 kicks in.”
The SPX reached $ 5,784 last week, leaving us just 0.3% short. It dipped below $5,504 on Monday, only to close higher and rebound to yesterday’s peak. However, the response to “Liberation Day” suggests that the green W-c of the red W-iv, ideally at $ 5,140 ± 20 when assuming a standard Fib-based impulse lower, should now be underway. This target zone is close to the ideal level of $ 5,116. See Figure 3 below.
Figure 3
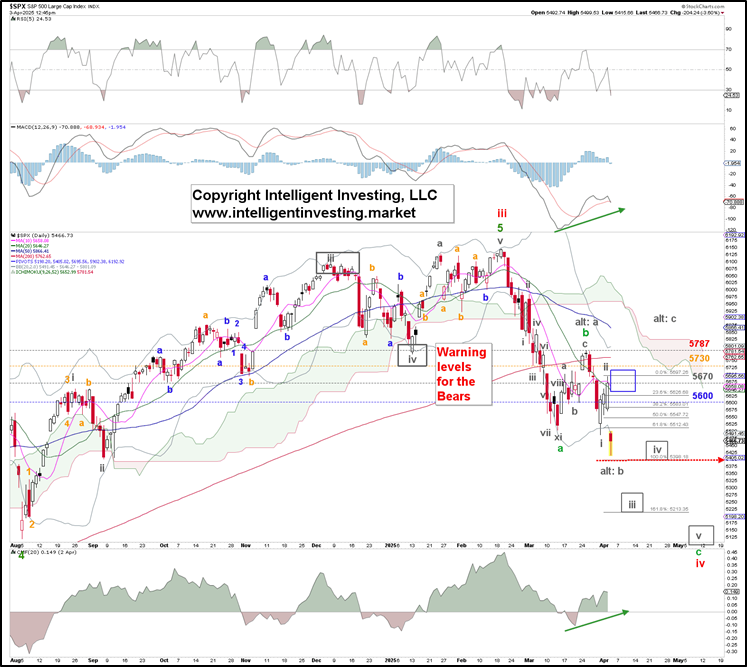
A decisive break below $ 5,398 is necessary to confirm this path. Namely, if that level holds and we see a significant reversal, the index could still attempt to re-enter the $5,900 to $6,000 range. That’s our alternative view.
For now, take a deep breath, zoom out, and remember that cooler heads prevail.
- There are no signs of a bear market.
- Even if there is one, history shows us (see Figure 1) that each Bear market Is a Major Buying Opportunity (BIMBO) for those with a time horizon longer than a few days to weeks.
- The SPX continues to follow a standard Fibonacci-based impulse pattern that began in March 2020, which we outlined several weeks ago.
Author

Dr. Arnout Ter Schure
Intelligent Investing, LLC
After having worked for over ten years within the field of energy and the environment, Dr.


