Is the SP500 en route to new all-time highs?

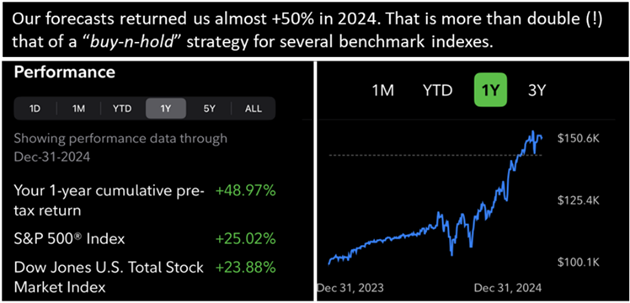
Happy New Year to new and regular readers of our work. We primarily use the Elliott Wave (EW) to forecast the financial markets—in this case, the SP500 (SPX)—most likely paths forward. Although there are many ways to navigate the markets and to each their own, we find the EWP to be the most reliable and accurate. Our returns, see Figure 1 below, speak for themselves.
Figure 1. Our EWP-based trading return in 2024 for the SP500
For example, about eight (!) weeks ago we found for the SPX that
“we are looking at W-iii to reach at least SPX6060, W-iv should bottom around SPX5725, and W-v can reach at least SPX6260.”
We backed that up four weeks ago as we concluded
… we must allow it to ideally target SPX6060, possibly as high as SPX6175, before the next correction of around 5-7% can start.”
On December 19, when the index was trading at around $5900, we showed that the correction
“…should bottom out at around $5850+/-50 for a green W-a, bounce to $6000-6025 for a green W-b, and that a green W-c of the red W-iv should bottom out around $5735-5810 over the coming days before W-v can reach at least $6280.”
How did our forecasts fare?
- The index peaked on December 6 at $6099. We forecasted $6060-6175.
- It then bottomed out on December 20 at $5982. We expected $5850+/-50.
- Rallied to $6049 by December 26. We showed $6000-6025.
- The index dropped to $5829 on January 2nd. We forecasted $5735-5810.
Thus, with an accuracy of around ±2%, we reliably anticipated using the EWP where the index should top and bottom up to two months ahead. Of course, we could not know the exact path the market would take. Still, as more price data became available, we could specify the expected path, increasing our accuracy to less than ±0.5%.
Figure 2. Preferred Elliott Wave count for the SP500
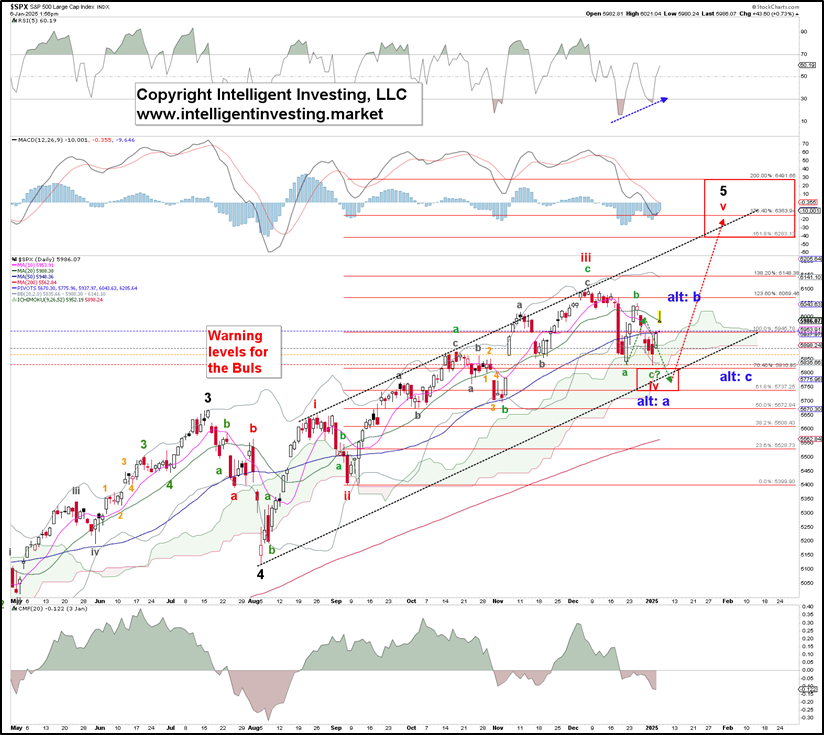
We, therefore, continue to assign the index's advance since the August 2024 low an Ending Diagonal (ED) structure. As a reminder, an ED’s waves (i-ii-iii-iv-v) comprise three waves: 3-3-3-3-3 = abc-abc-abc-abc-abc. Besides, W-iii typically targets the 123.60% extension of W-i, measured from W-ii. The W-iv then tends to correct back to the 61.80% extension, after which the last W-v targets the 161.80% extension. Since, so far, the index is running a bit ahead, e.g., it held the 76.40% extension, we now anticipate it is more likely to reach the 176.40% extension at $6363. See Figure 2 above. But, as always, we will monitor the advance to narrow down the red W-v target zone.
For now, we have had a 192p rally from the January 2nd low, and as long as that low holds, we must assign the rally to the (subdividing) red W-v. The warning levels for the Bulls are marked on the daily chart, with a first warning on a break below last Friday’s close, etc.
The alternative (blue Alt: a, Alt: b, Alt: c) is that the red W-iv will become protracted, with the current rally most likely stalling out at around $6050+/-25 once again, followed by another leg lower to the red W-iv target zone. A break below the orange warning level of $5868 will strongly suggest this.
However, we slice and dice it; over the intermediate term, the index is most likely not yet done to the upside, and even after a possible last leg lower better into the ideal $5735-5810 target zone, we can still expect a rally to new all-time highs. But please note that once the $6200+ region has been reached, a much larger correction, if not an outright multi-year Bear market, can start.
Author

Dr. Arnout Ter Schure
Intelligent Investing, LLC
After having worked for over ten years within the field of energy and the environment, Dr.


