Is the Semiconductor Index ready to rally?

In our previous update, we asked if the Semiconductor Index (SOX) was ready to rally by using the Elliott Wave (EW) Principle and concluded
“the EWP suggests that the risk from current price levels lies between $3,800 and $4,040, with a potential reward of approximately $5,000 to $5,700.”
We found the risk by applying a standard Fibonacci-based impulse pattern, where the 3rd wave (W-iii) targets the 1.382-1.618 extension of W-i, measured from W-ii. The subsequent 4th wave (W-iv) reaches the 0.764-1.000x extension, and the final W-v targets the 1.764-2.000x Fib-extension. See the red boxes in Figure 1 below.
The index dropped and stalled perfectly inside the ideal (red) W-iii and W-iv target zones. So far, so good. However, the response to the more-than-expected tariffs last week extended the red W-v as the SOX bottomed, so far, at $3,388. Extensions of waves can always happen but cannot be known beforehand. Hence, we start with the ideal Fibonacci-based impulse pattern, and when it is invalidated, we apply, in this case, an extended pattern. Therefore, “all we can do is anticipate, monitor, and adjust, if necessary.”
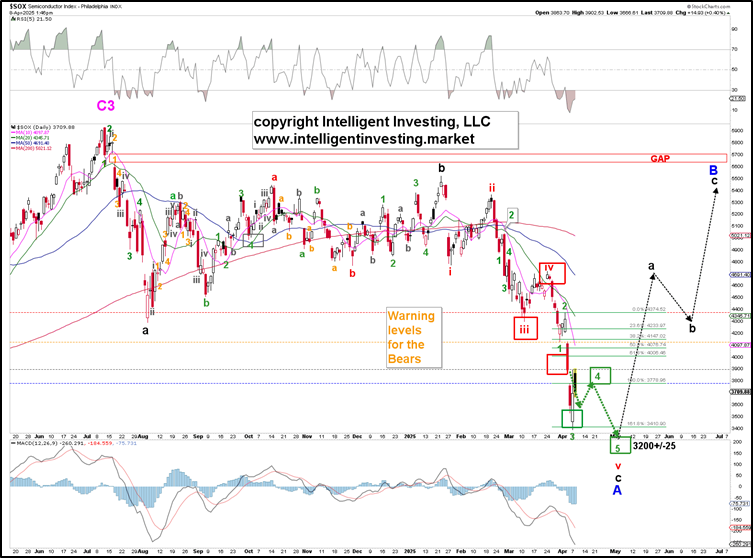
However, now that the red W-v is extending, i.e., subdividing in EWP terms, into the green W-1, 2, 3, 4, 5, we can see that it so far bottomed right at the 161.8% extension, and the index also peaked inside the ideal green W-4 target. Thus, we must assume the green W-5 will reach the 1.764-2.000x target zone at $3,323-3,183 contingent on holding below last Wednesday’s high at $4,374, with a severe warning for the bears above $4,129
Since our EWP count indicates an enormous Cycle-3 wave peaked in 2024, as shown in Figure 2 below, we are currently experiencing a Cycle-4 wave. Fourth waves are typically described in EW terminology as flat corrections. Additionally, EW theory includes a rule of alternation: Wave 4 differs from Wave 2. In this context, Cycle W-2 was an extended nine-year-long zigzag; therefore, Cycle W-4 is likely to be a multi-year flat.
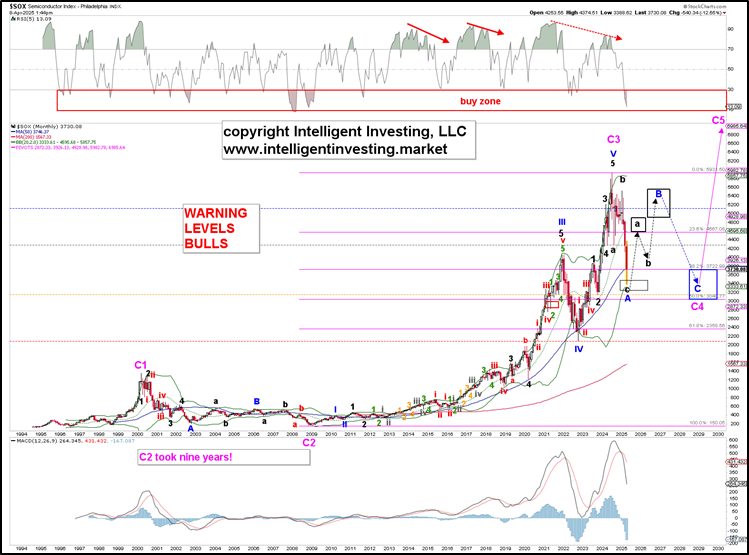
Flat corrections follow a 3-3-5 pattern (A-B-C = abc-abc-12345), where A is approximately equal to B and C in its most basic form. Therefore, the first leg (A = abc) is about to complete, and the second leg (B = abc) is about to begin. Since A is approximately equal to B in this case, we should expect the index to return to the $5,000s, with a gap fill around $5,700 as a potential target, following the outlined black dotted path.
Thus, while we could not foresee the extension of the final fifth wave in our previous update, we prudently provided a risk/reward analysis based on standard Fibonacci-based patterns. Moreover, we missed only one out of five target zones, allowing precise and rewarding trading.
In the short term, we expect the downside to continue to ideally $3,253+/-70, contingent on holding below last Wednesday’s high at $4,374, with a severe warning for the bears above $4,129. However, we don’t sweat the small stuff (a few 100p) as our long-term view remains the same as last week: a rally back to ideally ~$5,700 (several 1000p).
Author

Dr. Arnout Ter Schure
Intelligent Investing, LLC
After having worked for over ten years within the field of energy and the environment, Dr.


