Is the Semiconductor index ready to rally?

Despite the prevailing bearish sentiments of the day, which should never be given in to, the Semiconductor Index (SOX) appears ready to rally. We will demonstrate this using the Elliott Wave (EW) Principle.
Figure 1 below illustrates that the index is completing five downward waves (in red) from its January high. It also demonstrates that the index has closely followed a standard Fibonacci-based impulse pattern. The red waves W-iii and W-iv reached their respective peaks and troughs within their ideal target zones, while the red wave W-v may have fallen short. A close above $4,200 will indicate its completion. Furthermore, according to EW theory, we can expect at least three upward waves to follow the conclusion of the five downward waves.
Figure 1
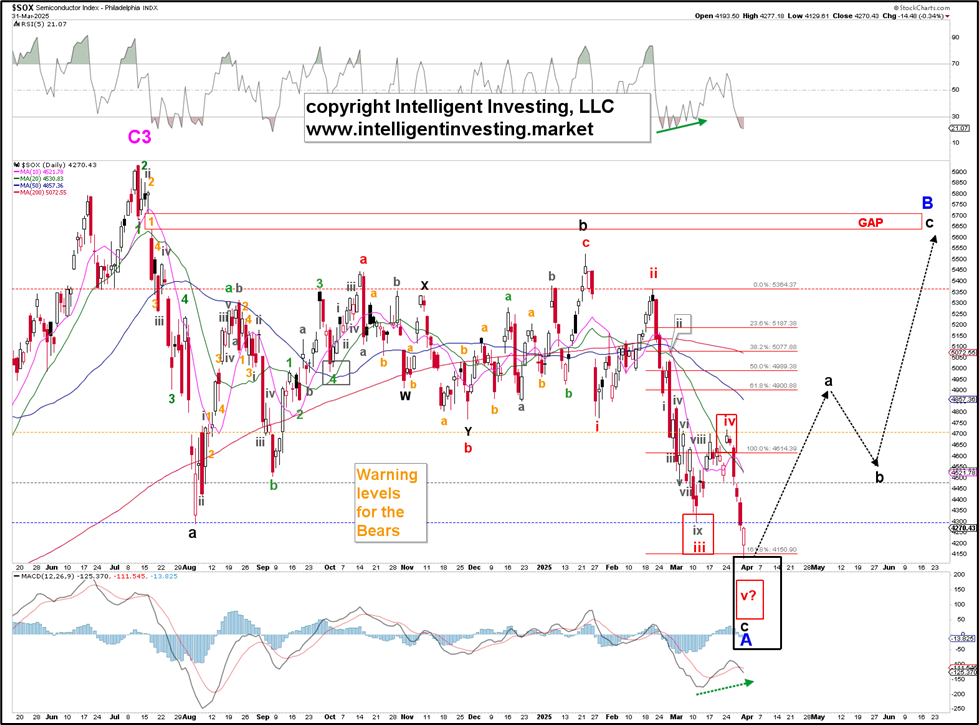
Additionally, we can observe that the index has formed three larger waves since its all-time high in July 2024: waves a, b, and c (black). The August low marked W-a, and the January high represented a very complex W-b, while W-c is now nearing completion. Furthermore, the ideal target zone for W-c (the black square) has been reached, but the optimal red W-v target zone, at $3864-$4040, has not yet been met. While it would be favorable, the market is not obligated to comply; it owes us nothing and has already done enough to present a five-wave sequence. This is also why we consistently state that we are 70% reliable and 95% accurate: two out of three target zones have been achieved.
Since our EWP count indicates a more significant Cycle-3 wave, as shown in Figure 2 below, we are currently experiencing a Cycle-4 wave. Fourth waves are typically described in Elliott Wave (EW) terminology as flat corrections. Additionally, EW theory includes a rule of alternation: Wave 4 differs from Wave 2. In this context, Cycle W-2 was an extended zigzag; therefore, Cycle W-4 is likely to be a flat and possibly a triangle.
Figure 2
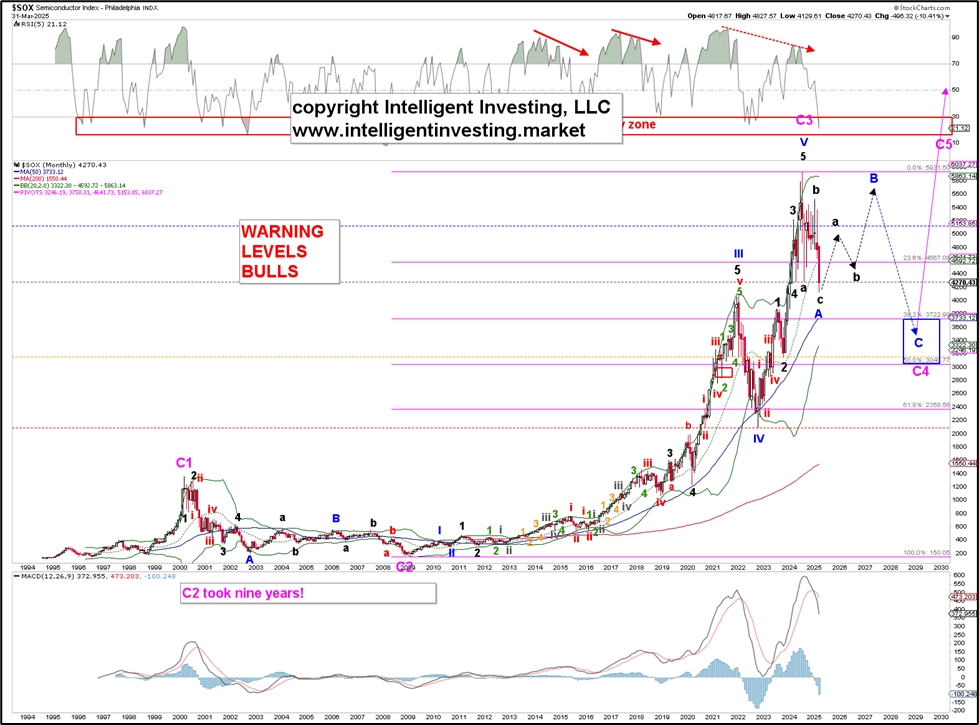
These types of corrections follow a 3-3-5 pattern (A-B-C = abc-abc-12345), where A is approximately equal to B and C. Therefore, the first leg (A = abc) has likely been completed, and the second leg (B = abc) is about to begin. Since A is approximately equal to B in this case, we should expect the index to return to the high $5,000s, with a gap fill around $5,700 as a potential target, following the outlined dotted path.
Since financial markets are probabilistic, those seeking certainty will never cease their search. We may also experience a limited retracement, as indicated by the EWP count shown in Figure 3. In EWP terminology, we refer to this as our alternative count, which serves as an insurance policy, so to speak. Instead of potentially rallying as high as $5,700, the index may stall around $5,000 ± $100 for a minor counter-trend rally before entering a deeper plunge down to the mid-to-low $3,000s.
Figure 3
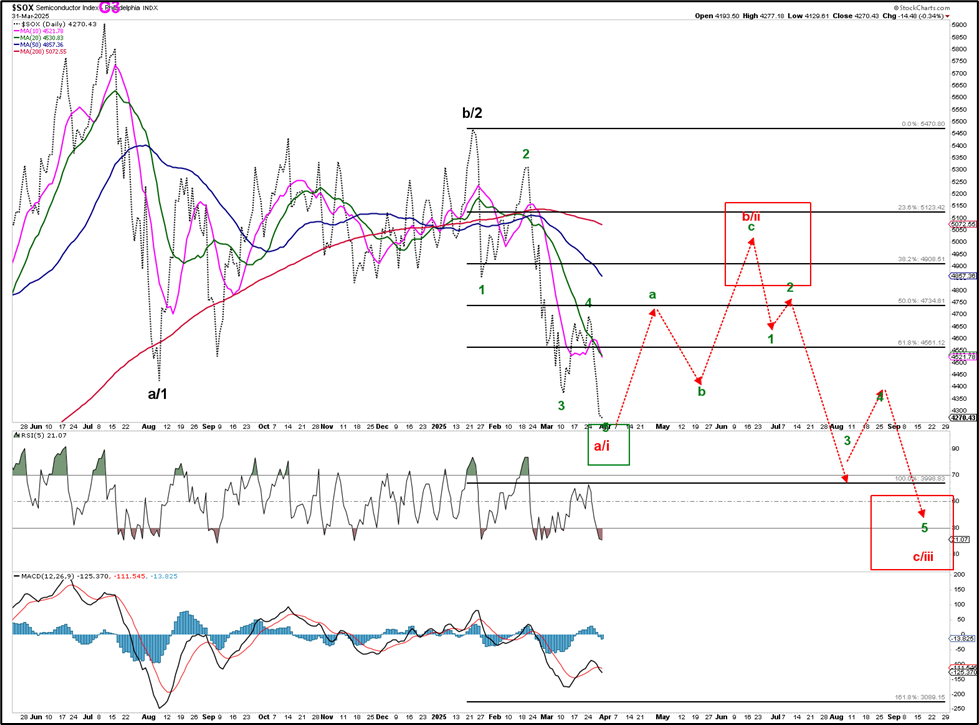
At this stage, we cannot distinguish between the two options; however, both are likely to pursue higher prices in the intermediate term (weeks to months). Therefore, while we are uncertain in the short term whether the index has completed its five downward waves from the January high, the EWP suggests that the risk from current price levels lies between $3,800 and $4,040, with a potential reward of approximately $5,000 to $5,700.
Author

Dr. Arnout Ter Schure
Intelligent Investing, LLC
After having worked for over ten years within the field of energy and the environment, Dr.


