Is the market bottom here? Will the S&P 500 break down further? [Video]
![Is the market bottom here? Will the S&P 500 break down further? [Video]](https://editorial.fxstreet.com/images/Markets/Equities/SP500/wall_street_nyse4-637299025173341169_XtraLarge.jpg)
Watch the free-preview video extracted from the WLGC session before the market opens on 13 Aug 2024 to find out the following:
-
How does the increasing volatility impact the likelihood of a market bottom?
-
1 simple way to judge the quality of the relief rally.
-
The 3 characteristics you must know for the recent selloff to determine the future direction.
-
The key level to violate the bearish flag scenario.
-
And a lot more…
As the relief rally unfolds, some stocks show outperformance with a decent setup. However, the elevated volatility, supply increase and acceleration to the downside still suggest a test of the low formed by the capitulation bar on 1 Aug 2024.
The downside target as discussed in the video last week is still valid.
Although yesterday the S&P 500 broke above the axis line at 5435, it is still testing the breakdown bar on 2 Aug 2024. Watch out for the emergence of the supply at the current zone.
Market environment
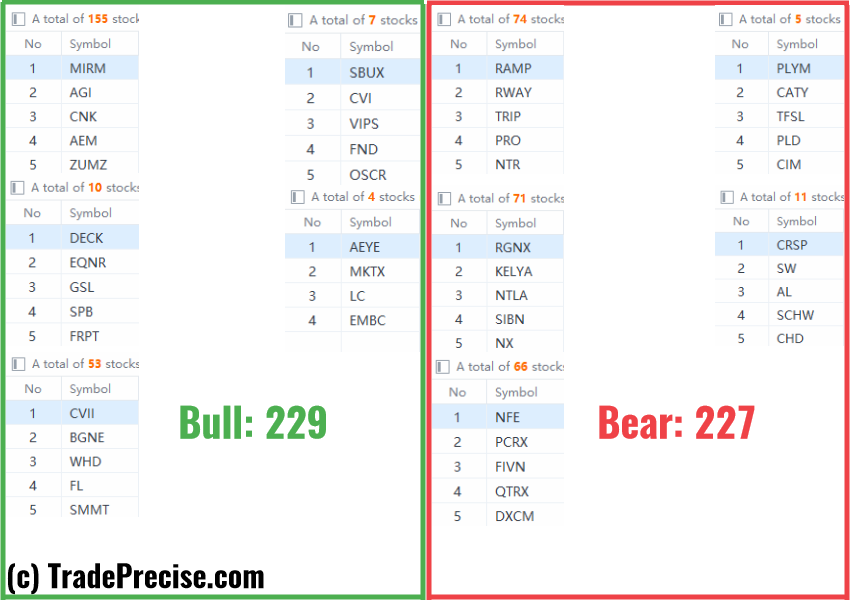
The bullish vs. bearish setup is 229 to 227 from the screenshot of my stock screener below.
Three stocks ready to soar
11 actionable setups such as AEM, CNK, SFM were discussed during the live session before the market open (BMO).
The elevated volatility is still not favourable for swing trading. If I were to trade, I would cut down to 1/2 of the normal position size and use conservative trade management to protect the capital.
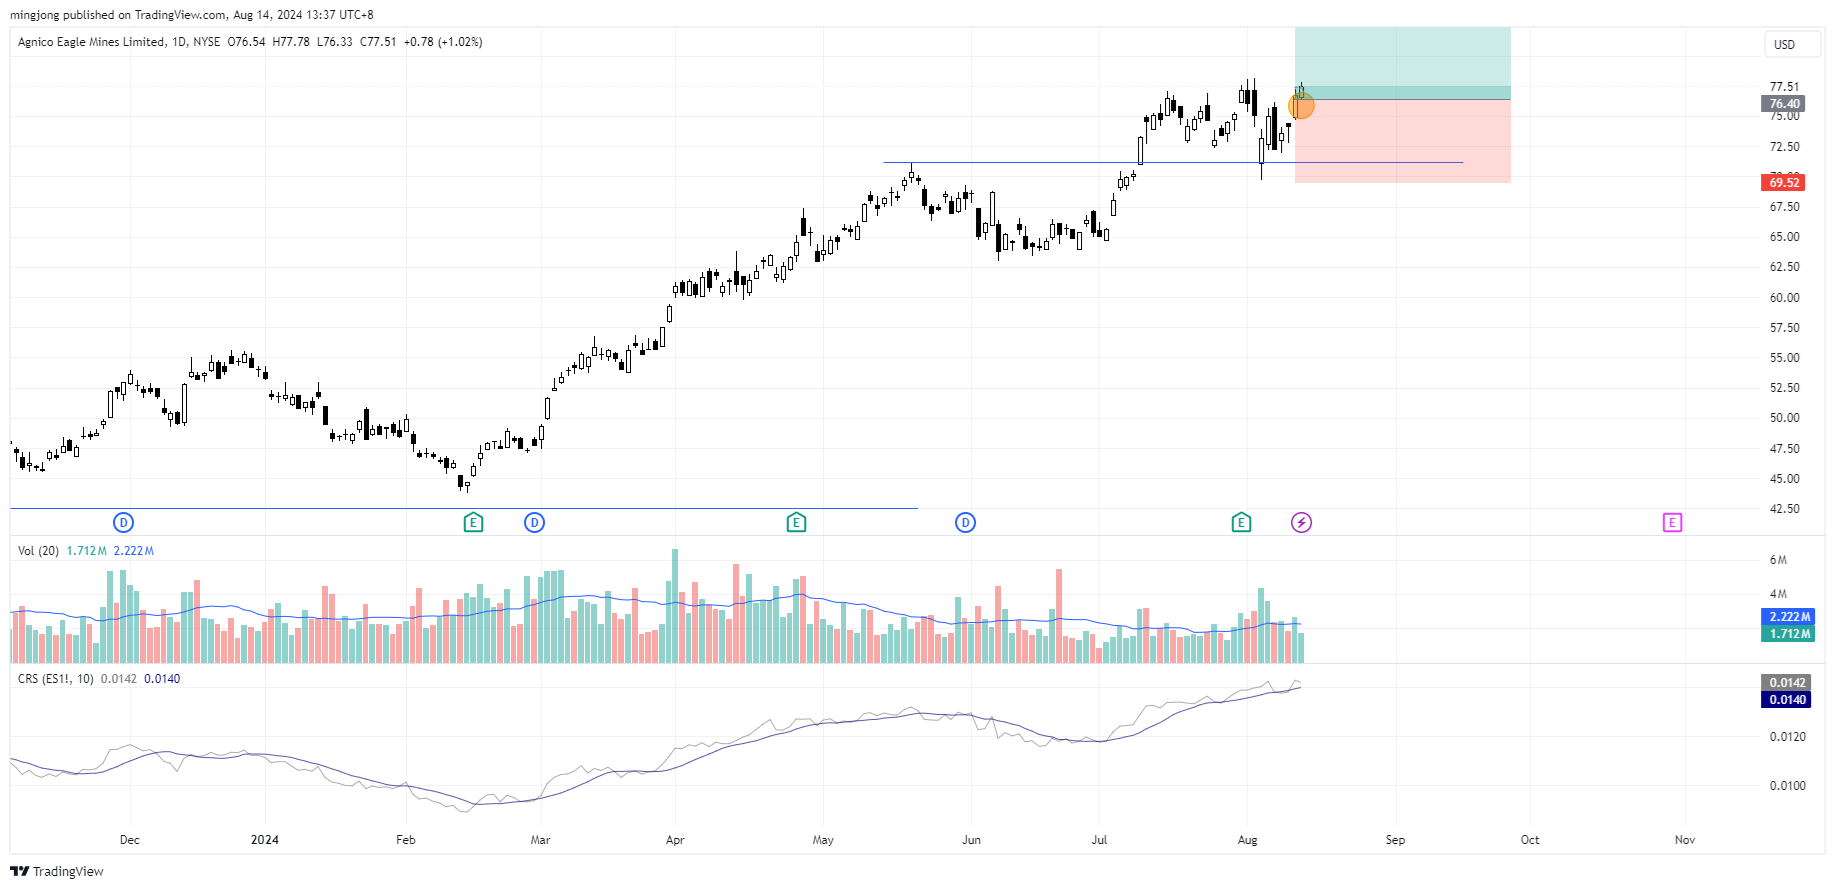
AEM
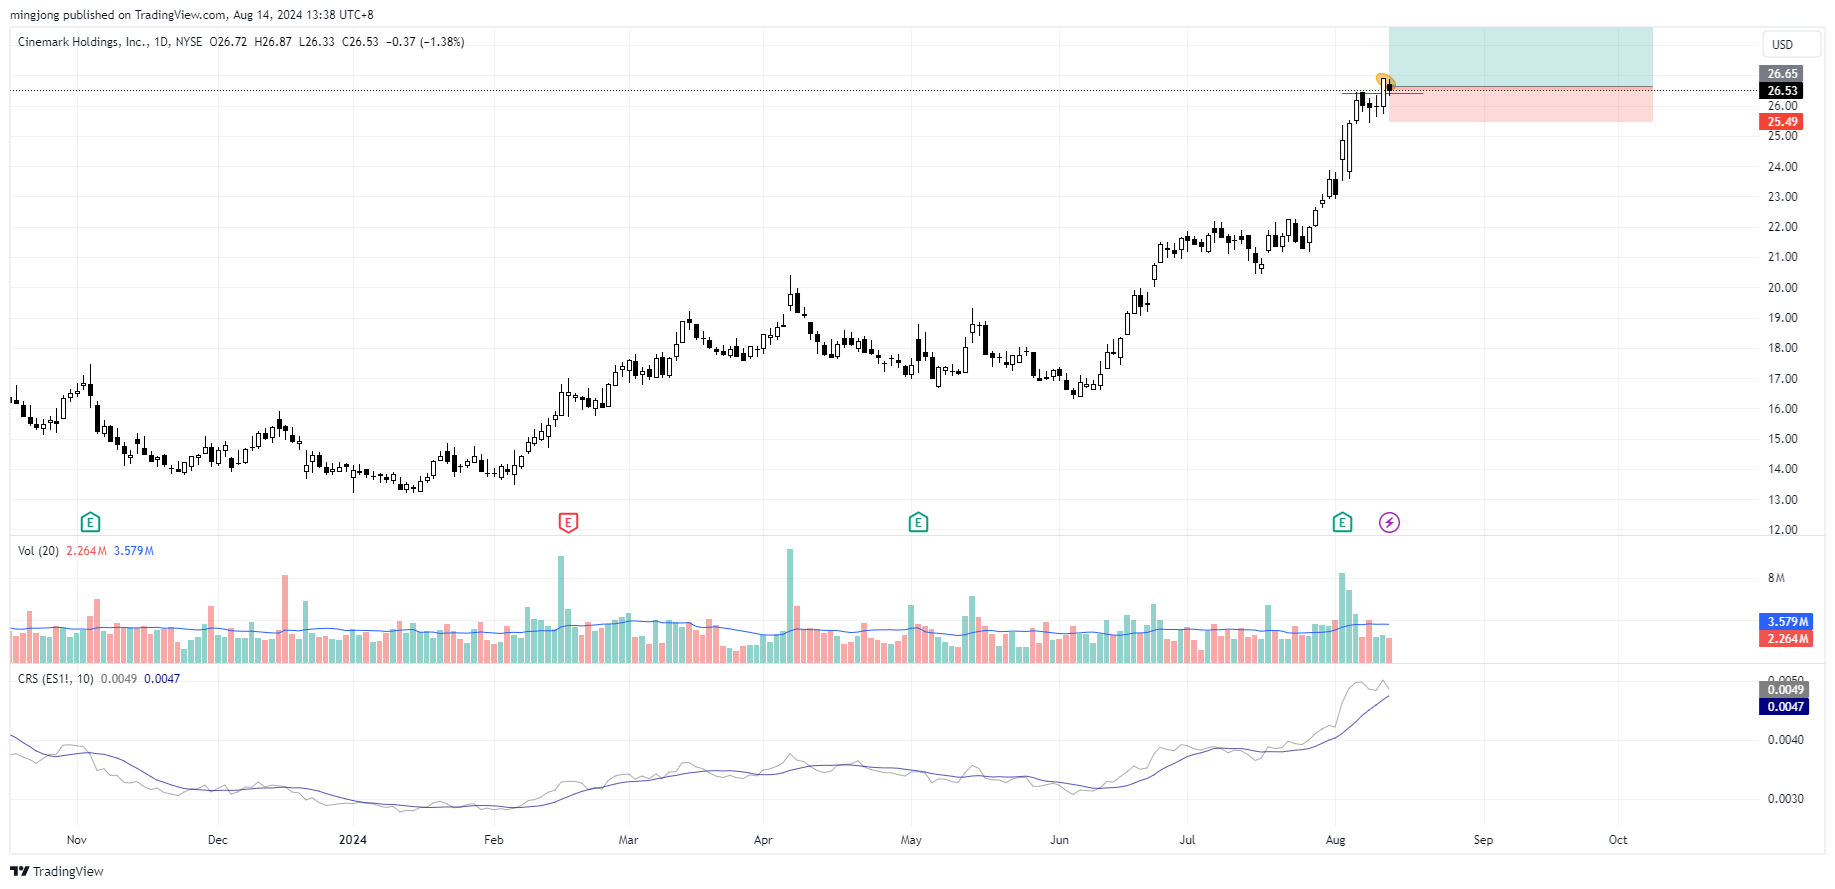
CNK
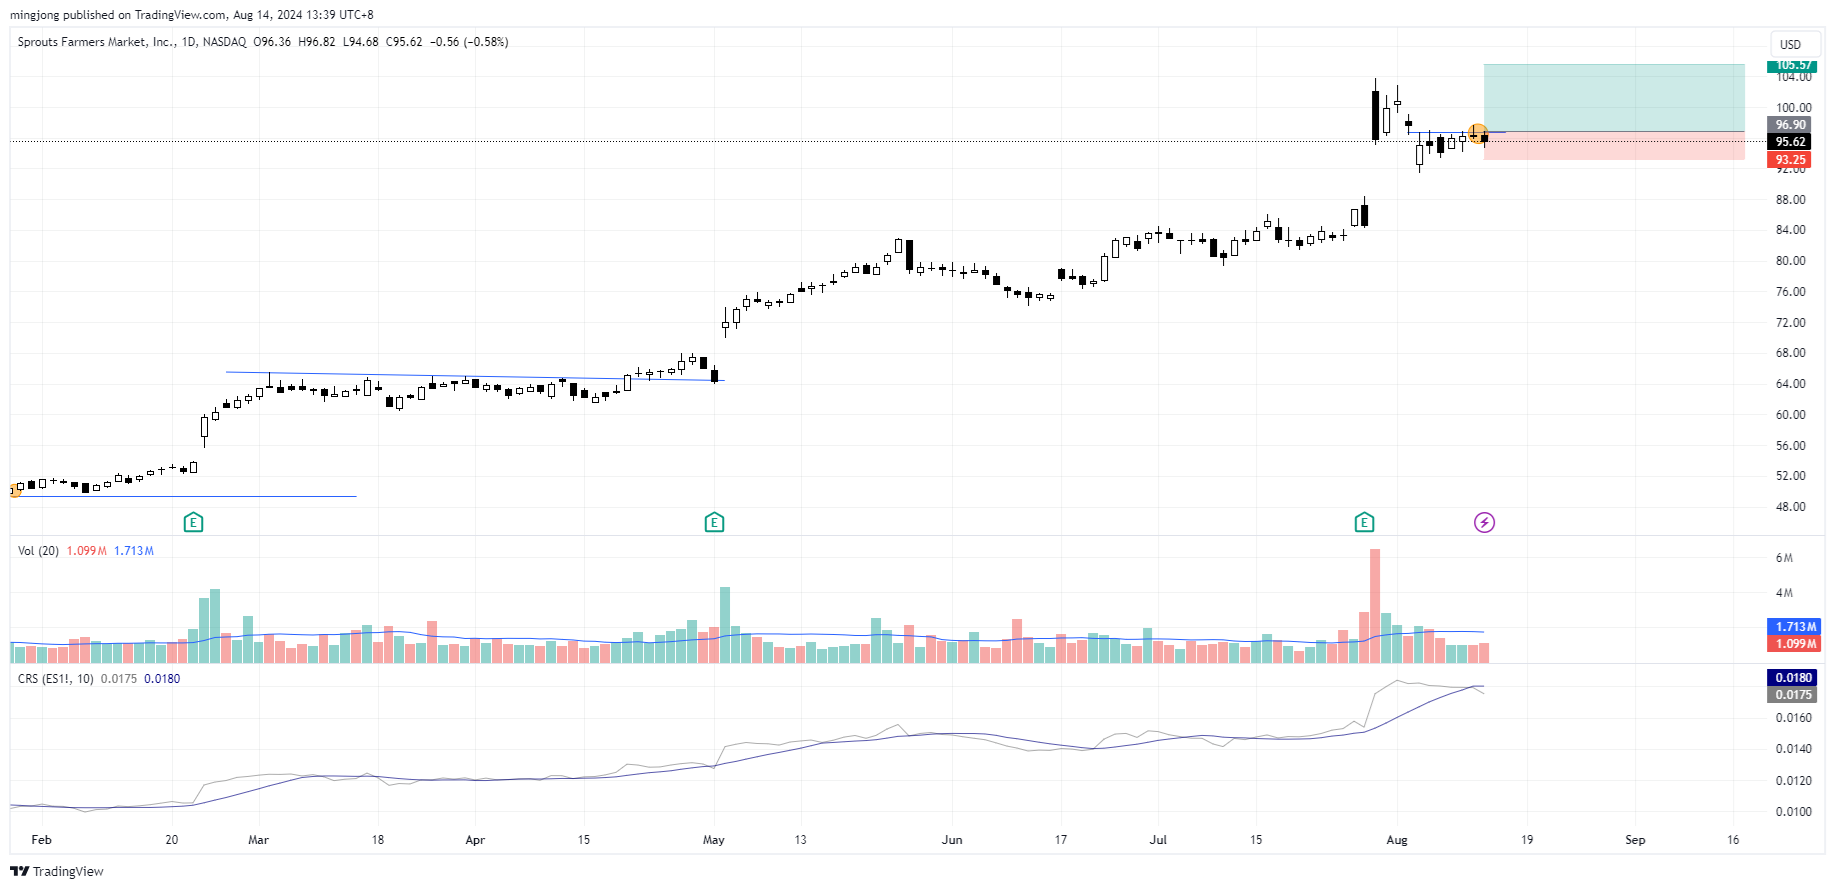
SFM
Author

Ming Jong Tey
Independent Analyst
Ming Jong Tey has been trading since 2008. He started his learning journey from technical analysis (indicators, Fibonacci, etc...) to value investing. Throughout his journey, he develops an interest in price action with chart pattern trading.


