Is the bull run nearing its end? Trading context analysis for S&P 500 [Video]
![Is the bull run nearing its end? Trading context analysis for S&P 500 [Video]](https://editorial.fxstreet.com/images/Markets/Equities/SP500/wall_street_nyse2-637299021353183737_XtraLarge.jpg)
Watch the video extracted from the WLGC session before the market open on 9 Apr 2024 below to find out the following:
- How to interpret the change of character bar and the structure context to anticipate the next move.
- The key indicators suggesting potential exhaustion of bullish momentum in the S&P 500.
- The strong industry groups you should focus on instead.
Market environment
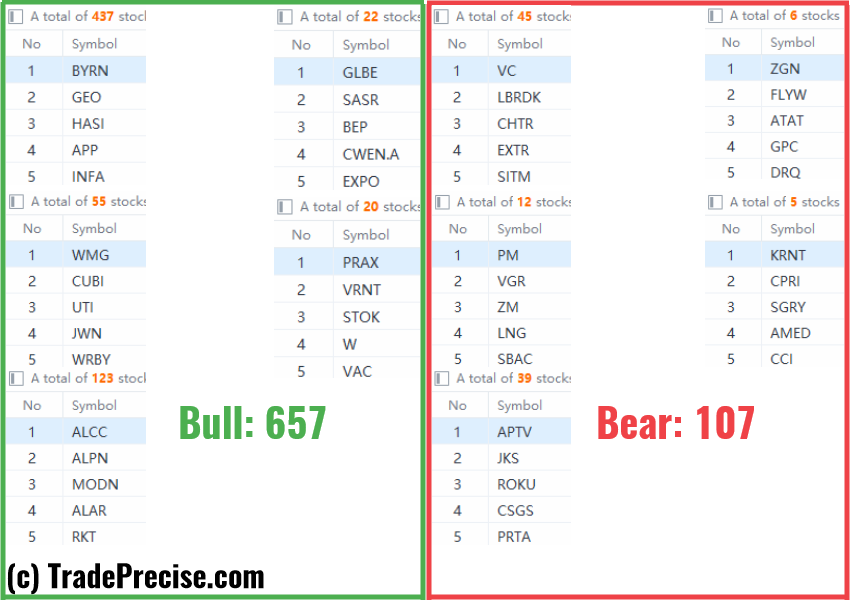
The bullish vs. bearish setup is 657 to 107 from the screenshot of my stock screener below.
Commodities like Copper, and Crude Oil continue to outperform with strong follow-through in individual stocks.
Market comment
18 “low-hanging fruits” (ARHS, ETRN, etc…) trade entries setup + 11 actionable setups (SCCO etc…) were discussed during the live session before the market open (BMO).
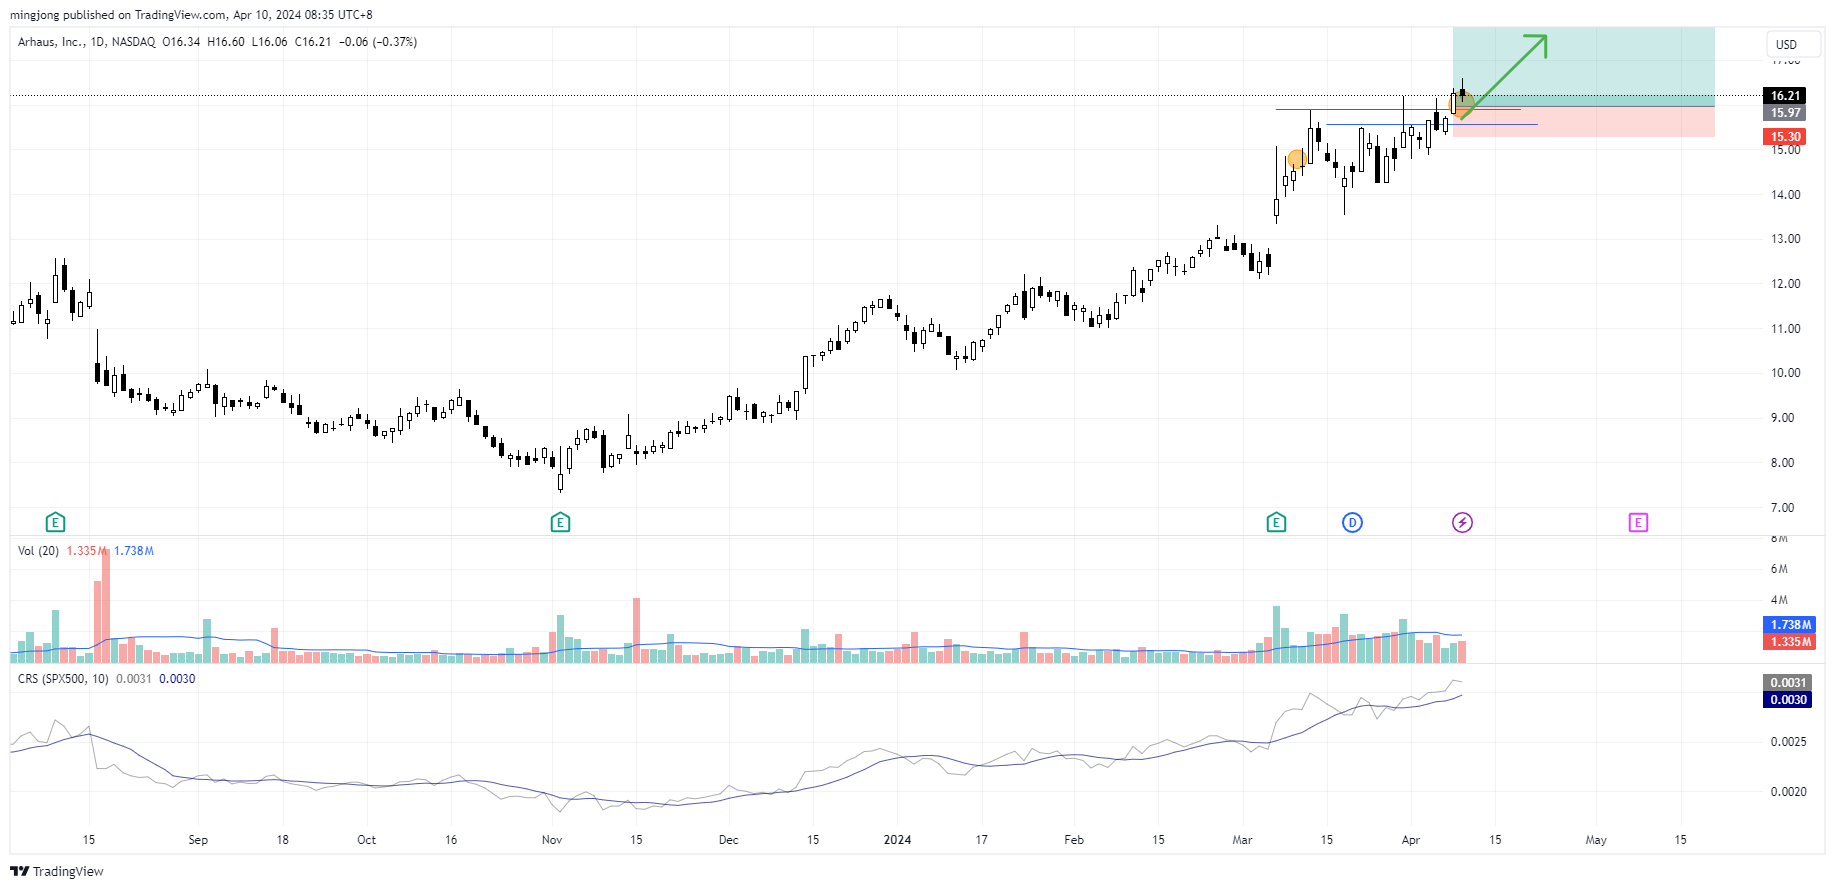
ARHS
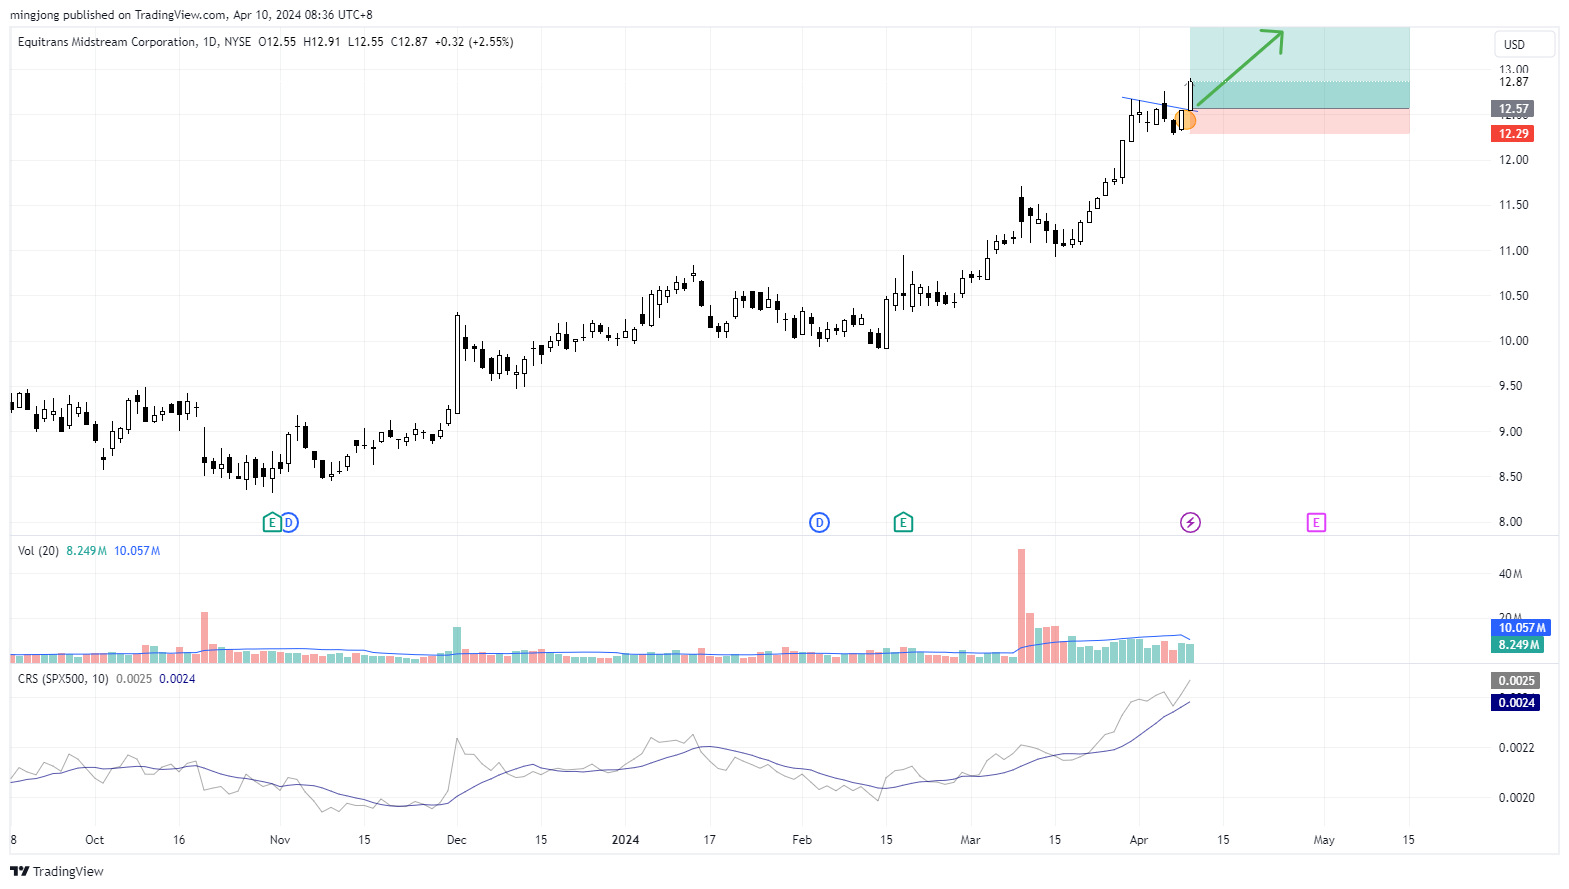
ETRN
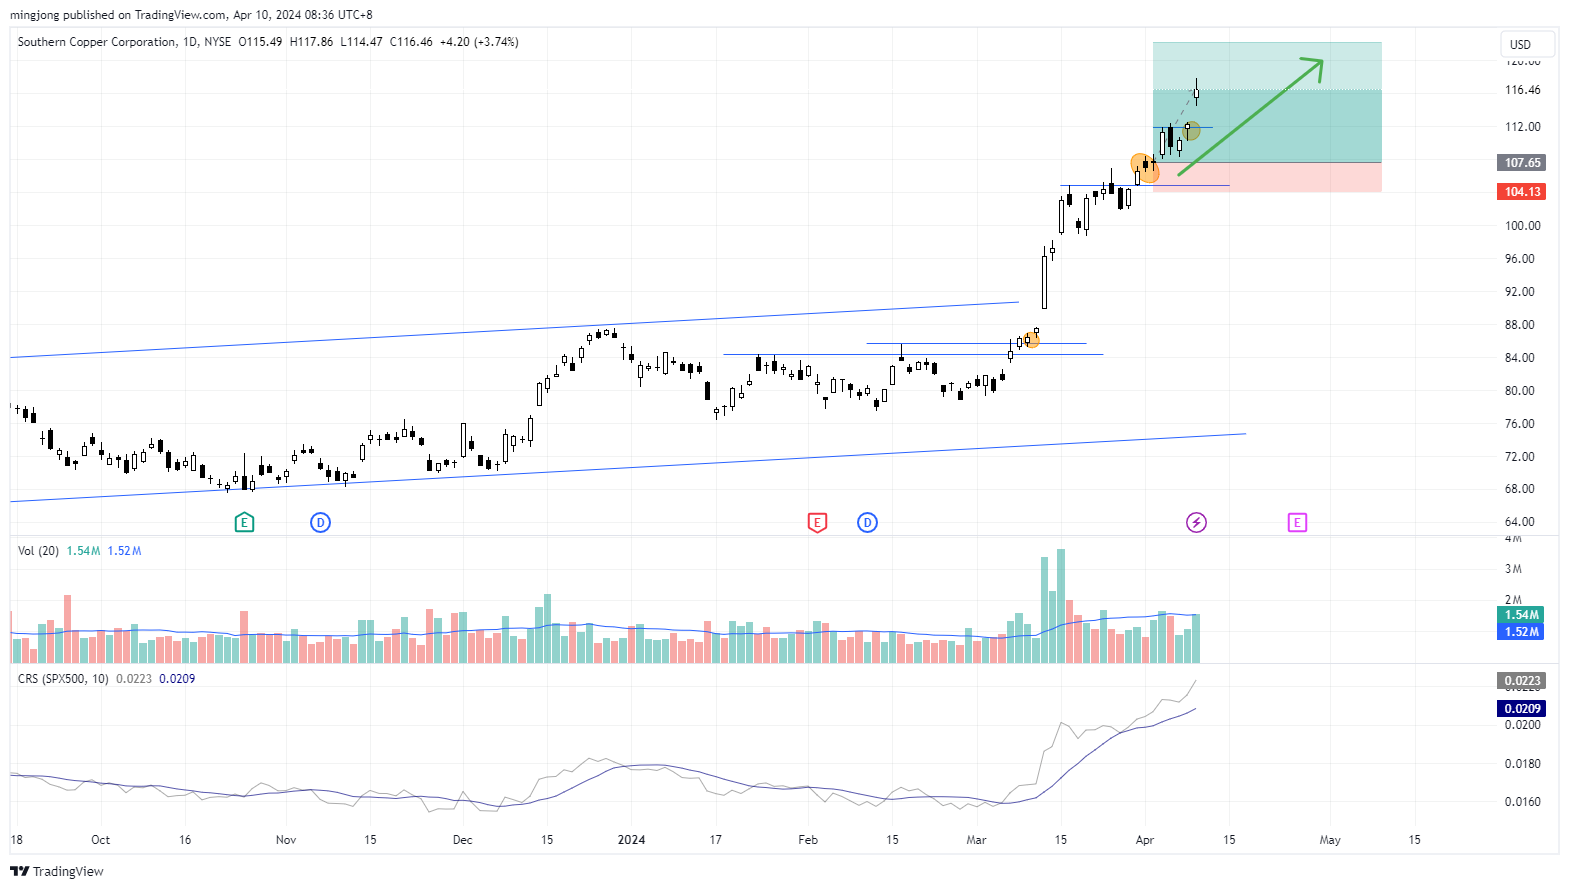
SCCO
Author

Ming Jong Tey
Independent Analyst
Ming Jong Tey has been trading since 2008. He started his learning journey from technical analysis (indicators, Fibonacci, etc...) to value investing. Throughout his journey, he develops an interest in price action with chart pattern trading.


