Is stocks rally showing signs of exhaustion?

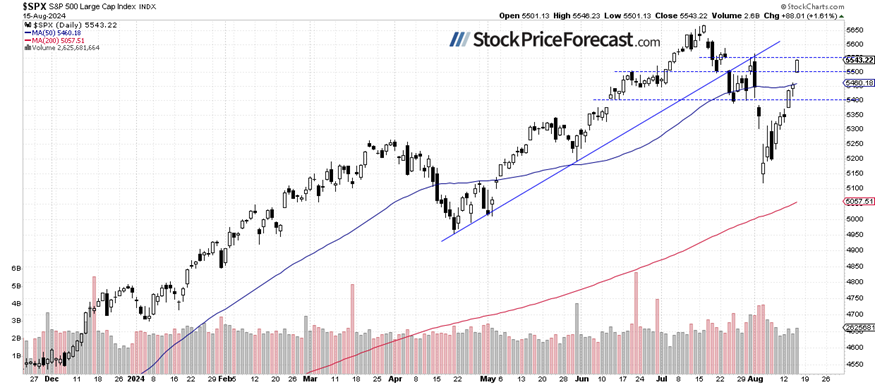
Stocks further accelerated their uptrend yesterday, with the S&P 500 index closing 1.61% and reaching new local highs above the 5,500 level. The market has retraced almost all of its declines from the August 1 local high of 5,566.16. The rebound surprised a majority of traders and the question is: Will the market go straight to new highs, or will it reverse at some point and retrace the rally? For now, there have been no confirmed negative signals; however, this morning, the S&P 500 is likely to open 0.6% lower, as indicated by futures contracts.
Yesterday, I wrote “It still appears to be a correction following a decline that started in mid-July; however, the market may also advance towards a double-top or new highs.” It is still correct as we could see a medium-term consolidation following the early August volatility.
Investor sentiment improved, as indicated by the Wednesday's AAII Investor Sentiment Survey, which showed that 42.5% of individual investors are bullish, while 28.9% of them are bearish – down from 37.5% last week.
The S&P 500 index neared its early August local high yesterday, as we can see on the daily chart.
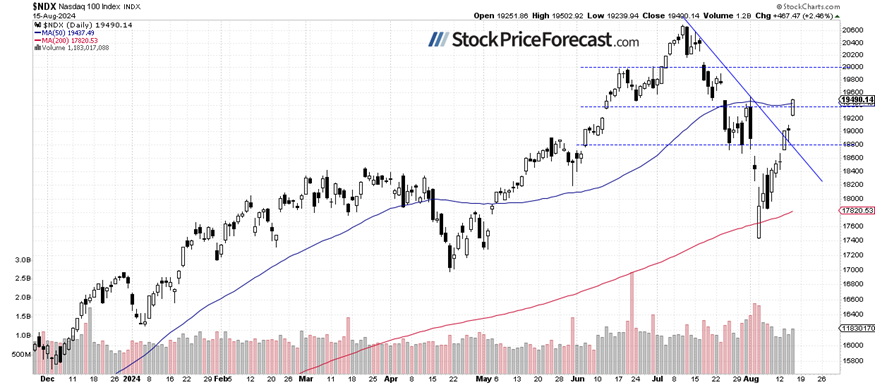
Nasdaq 100 approached 19,500
The technology-focused Nasdaq 100 accelerated its short-term uptrend on Tuesday, on Wednesday, it fluctuated, and yesterday, it rallied again, closing 2.46% higher. This morning, the Nasdaq 100 is likely to open 0.2% lower. The resistance level remains at 19,500-19,550, marked by the August 1 local high of around 19,539.
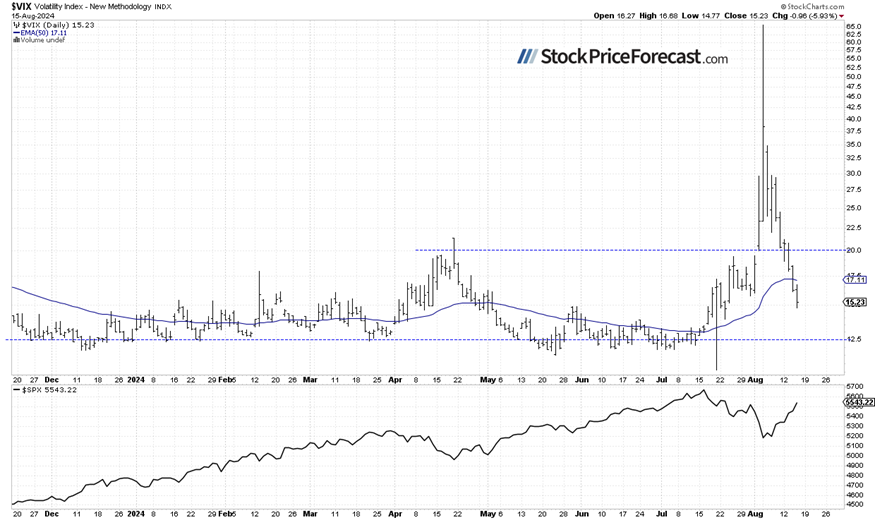
VIX: Closer to 15
Last Monday, the VIX index, a measure of market fear, reached a new long-term high of 65.73 - the highest level since the 2008 financial crisis and the COVID sell-off in 2020. This reflected significant fear in the market. However, since then, it has been retracing, and yesterday, it dropped as low as 14.77, indicating much less fear.
Historically, a dropping VIX indicates less fear in the market, and rising VIX accompanies stock market downturns. However, the lower the VIX, the higher the probability of the market’s downward reversal. Conversely, the higher the VIX, the higher the probability of the market’s upward reversal.
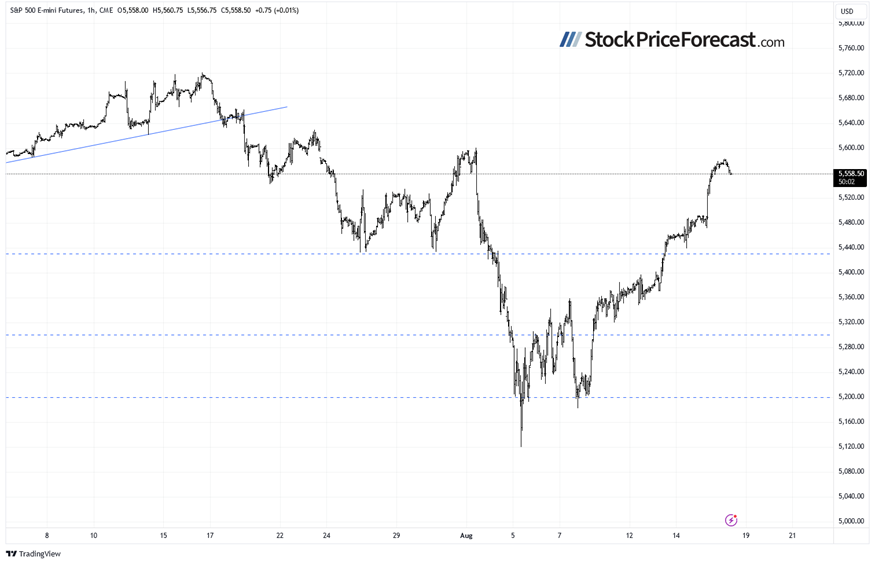
Futures contract: Getting closer to 5,500
Let’s take a look at the hourly chart of the S&P 500 futures contract. Yesterday, it accelerated the uptrend, reaching a new local high of around 5,583. This morning, the market is trading slightly lower, retracing some of its yesterday’s rally. For now, it looks like a downward correction. However, the market may pull back towards the broken resistance level of 5,500.
Conclusion
In my Stock Price Forecast for August, I noted “a sharp reversal occurred, and by the end of the month, the S&P 500 experienced significant volatility following the sell-off. August is beginning on a very bearish note, but the market may find a local bottom at some point.”
The rebound from last Monday’s low has been significant, and bulls have regained control of the market. Will this lead to new record highs? For now, it still seems like a correction within the downtrend. However, if the market breaks above its early August local high, the road to re-test the all-time high will be open.
Last Friday, I wrote “(…) rebound brought some hope for bulls, but it seems they are not out of the woods yet. The recent sell-off was significant, and it will likely take more time to recover.
There is also a chance that the current advances are merely an upward correction, and the market could revisit its lows at some point.”
My short-term outlook remains neutral.
Here’s the breakdown:
-
The S&P 500 index accelerated its short-term uptrend yesterday, reaching above 5,500 mark.
-
Today, the market is likely to retrace some of the advance; however, it’s far from reversing the uptrend.
-
In my opinion, the short-term outlook is neutral.
Want free follow-ups to the above article and details not available to 99%+ investors? Sign up to our free newsletter today!
Want free follow-ups to the above article and details not available to 99%+ investors? Sign up to our free newsletter today!
Author

Paul Rejczak
Sunshine Profits
Paul Rejczak is a stock market strategist who has been known for the quality of his technical and fundamental analysis since the late nineties.


