Is 6,060 the SP500’s next upside target?

In our previous update from late October, we found for the S&P500 (SPX) using the Elliott Wave (EW) that
“if the index holds above the early October low [of SPX5674], our red warning level for the Bulls, we can allow it to follow a more direct path to almost SPX6500. However, a break below last week’s low [of SPX5762] can trigger the alternative option, which has the index revisit SP5600+/-50 first before rallying again.”
The index broke below the SPX5762 low three days after writing but held above the early October low as it bottomed out on November 4 at SPX5696. From there, it staged a strong rally, primarily after the US Presidential Election outcome. However, due to the drop into early November, the subdividing impulse we shared with you, i.e., “a more direct path to almost SPX6500,” has morphed (back) into the Ending Diagonal structure we have been tracking prior. See figure 1 below.
Figure 1. Preferred Elliott Wave count
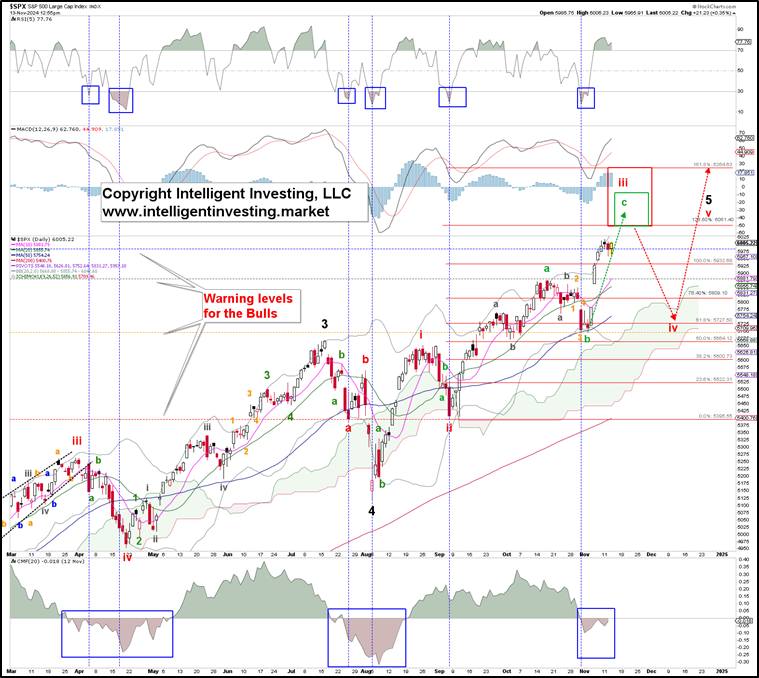
Ending Diagonals (EDs) are tricky because all their waves (i-ii-iii-iv-v) comprise three waves: 3-3-3-3-3 = abc-abc-abc-abc-abc. Besides, W-iii typically targets the 123.60% extension of W-i, measured from W-ii. The W-iv then tends to correct back to the 61.80% extension, after which the last W-v targets the 161.80% extension. In this case, we are looking at W-iii to reach at least SPX6060, W-iv should bottom around SPX5725, and W-v can reach at least SPX6260.
Thus, the red W-iii is still underway and subdividing into the green Waves a, b, and c, with the W-c now underway. This can reach the typical c=a extension at SPX6175ish. Thus, based on the standard EDs road map, which the market can deviate from, we expect the red W-iii to reach SPX6060-6175, where the red W-iv can materialize.
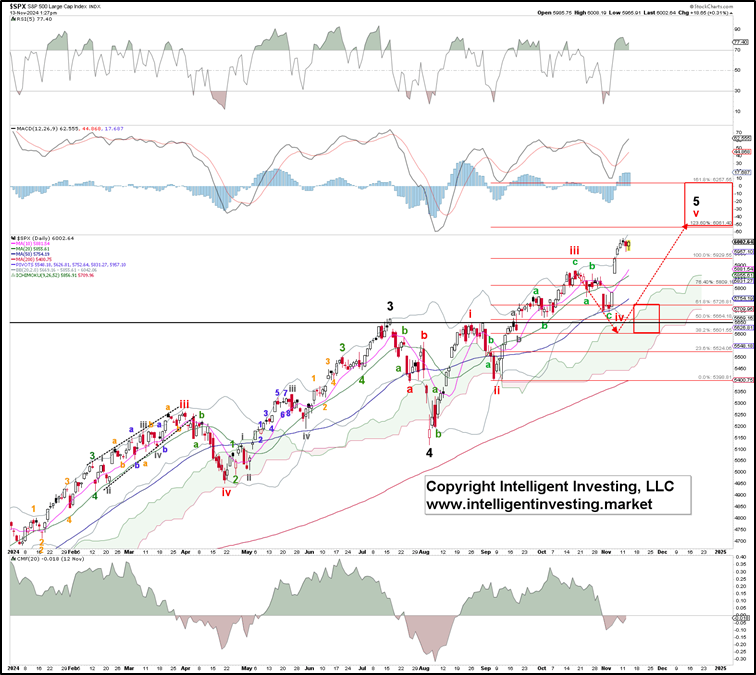
Our alternative EW count is shown in Figure 2 below. It postulates that the October 31 low was already the red W-iv, but it would make for an unorthodox short W-iii. Namely, W-iii would be shorter than W-i, which is allowed only if W-v will be shorter than W-iii. Thus, it would be very uncommon. Besides, the red W-iv low did not overlap with the red W-i high; see the black horizontal line. Also, this is not necessarily disallowed as a 4th wave does not have to overlap with a 1st wave in an ED, but it would also be very uncommon. Hence, why this is our low-odds alternative
Figure 2. Alternative Elliott Wave principle count
Thus, for now, if the index can stay at least above SPX5880, and especially last week’s low at SPX5696, we must allow it to ideally target SPX6060, possibly as high as SPX6175 before the subsequent correction of around 5-7% can start.
Author

Dr. Arnout Ter Schure
Intelligent Investing, LLC
After having worked for over ten years within the field of energy and the environment, Dr.


