Iron Ore (SGX TSI Index Futures) Elliott Wave Analysis.

SGX TSI Iron Ore Index Elliott Wave analysis

The SGX TSI Iron Ore Index is a critical benchmark for the iron ore market, providing valuable insights for traders, miners, and steelmakers involved in contract settlements and price risk management. The index's performance is derived from actual transactions in the iron ore spot market, offering a reliable reflection of market conditions.

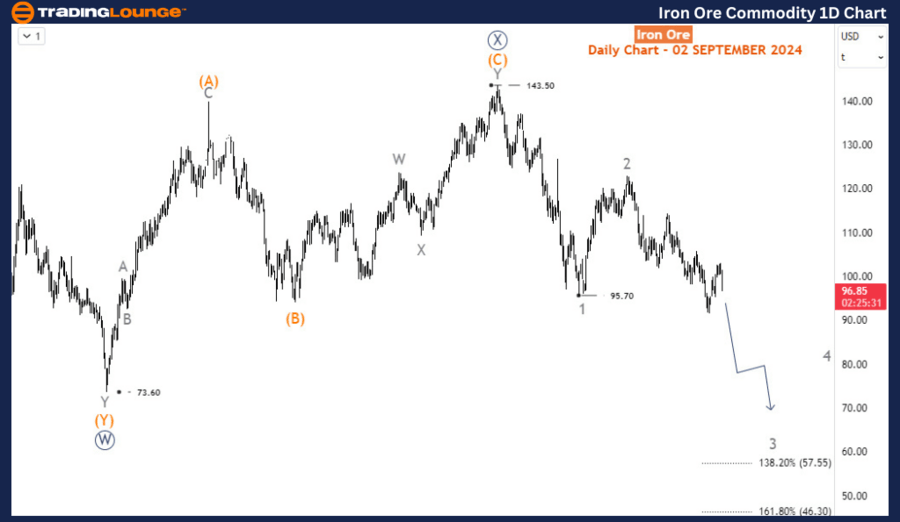
The SGX TSI Iron Ore Index reached an all-time high of approximately $233 per dry metric ton in May 2021, driven by strong demand from China and supply disruptions among major producers. This peak marked the beginning of a significant correction, with the index plummeting over 68% to $73 by October 2022. A recovery phase followed, pushing the index up to $143.5 by December 2023. However, after a strong rebound in April and May 2024, the index has reversed course, continuing the downtrend that started in January 2024.

Long-term Elliott Wave analysis

In May 2021, the index entered a bearish corrective phase, forming a primary W-X-Y wave pattern at the primary degree. The first leg, wave W (circled), was completed at the October 2022 low, and wave X (circled) culminated at the January 2024 high of $143.5. The ongoing wave Y (circled) began from this January 2024 peak and is projected to develop into a 3-wave structure consisting of intermediate degree waves (A)-(B)-(C).

Currently, the index is unfolding wave 3 of (A), which could potentially extend the price down to $45, suggesting a bearish long-term outlook. This wave structure indicates that the broader trend remains negative, with further downside expected as wave Y completes its formation.

Chart

H4 chart analysis

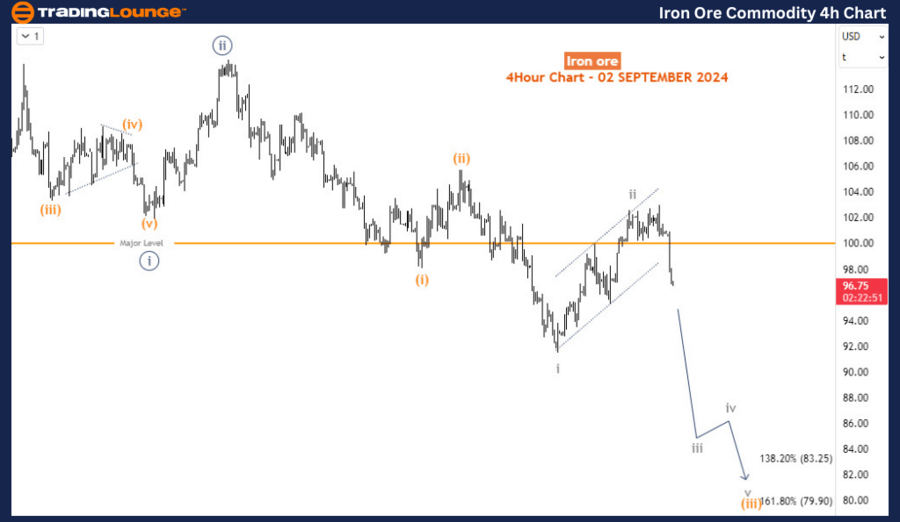
Zooming into the H4 chart, wave 3 started at $122.9 and is now advancing through its 3rd sub-wave, wave iii (circled) of 3. Within this, the price is progressing through wave (iii) of iii (circled) of 3. Near-term projections suggest that wave (iii) could drive the index down to $85 before encountering a corrective bounce in wave (iv). Following this brief retracement, the downward trend is expected to resume, aligning with the broader bearish outlook suggested by the long-term Elliott Wave structure.

Chart

Technical analyst: Sanmi Adeagbo.

SGX TSI Iron Ore Index Elliott Wave analysis [Video]

Share: Feed news

As with any investment opportunity there is a risk of making losses on investments that Trading Lounge expresses opinions on.

Historical results are no guarantee of future returns. Some investments are inherently riskier than others. At worst, you could lose your entire investment. TradingLounge™ uses a range of technical analysis tools, software and basic fundamental analysis as well as economic forecasts aimed at minimizing the potential for loss.

The advice we provide through our TradingLounge™ websites and our TradingLounge™ Membership has been prepared without considering your objectives, financial situation or needs. Reliance on such advice, information or data is at your own risk. The decision to trade and the method of trading is for you alone to decide. This information is of a general nature only, so you should, before acting upon any of the information or advice provided by us, consider the appropriateness of the advice considering your own objectives, financial situation or needs. Therefore, you should consult your financial advisor or accountant to determine whether trading in securities and derivatives products is appropriate for you considering your financial circumstances.

Recommended content


Recommended content

Editors’ Picks

EUR/USD holds steady slightly above 1.1050

EUR/USD holds steady slightly above 1.1050

EUR/USD fluctuates in a narrow range slightly above 1.1050 on the first trading day of September. The US Dollar struggles to build on the previous week's gains as trading conditions remain thin, with US markets remaining closed on Labor Day.

EUR/USD News
GBP/USD trades in tight channel below 1.3150

GBP/USD trades in tight channel below 1.3150

GBP/USD moves sideways below 1.3150 in the second half of the day on Monday. Financial markets in the US remain closed in observance of the Labor Day holiday, not allowing the pair to make a decisive move in either direction.

GBP/USD News
Gold fluctuates at around $2,500 to start the week

Gold fluctuates at around $2,500 to start the week

Gold struggles to find direction on Monday as it continues to move up and down at around $2,500. Later in the week, key macroeconomic data releases from the US, including August PMI figures and the jobs report, could trigger the next big action in XAU/USD.

Gold News
Crypto Today: Bitcoin at risk of further decline, Ethereum recovers to $2,500, XRP holds steady at $0.55

Crypto Today: Bitcoin at risk of further decline, Ethereum recovers to $2,500, XRP holds steady at $0.55

Bitcoin and Ethereum gain ground on Monday after opening September in the red. XRP hovers around $0.55 as pro-crypto attorneys discuss the impact of a possible SEC appeal to the Ripple lawsuit ruling. 

Read more
Week ahead: US labour data and the BoC rate announcement in focus

Week ahead: US labour data and the BoC rate announcement in focus

With US Federal Reserve Chair Jerome Powell’s recent speech at the Jackson Hole Symposium confirming that it is time to begin easing policy as well as underlining the importance of the jobs market, this week’s jobs data may help determine how the Fed approaches its easing cycle.

Read more
Moneta Markets review 2024: All you need to know

Moneta Markets review 2024: All you need to know

VERIFIED In this review, the FXStreet team provides an independent and thorough analysis based on direct testing and real experiences with Moneta Markets – an excellent broker for novice to intermediate forex traders who want to broaden their knowledge base.

Read More

Forex MAJORS

Cryptocurrencies

Signatures