Iron Ore (SGX TSI Index Futures) Elliott Wave analysis [Video]
![Iron Ore (SGX TSI Index Futures) Elliott Wave analysis [Video]](https://editorial.fxstreet.com/images/Markets/Equities/Industries/Software/software-code-637435356353853480_XtraLarge.jpg)
SGX TSI Iron Ore Index Elliott Wave analysis
The SGX TSI Iron Ore Index is a critical benchmark for the iron ore market, providing valuable insights for traders, miners, and steelmakers involved in contract settlements and price risk management. The index's performance is derived from actual transactions in the iron ore spot market, offering a reliable reflection of market conditions.
Overview and long-term analysis
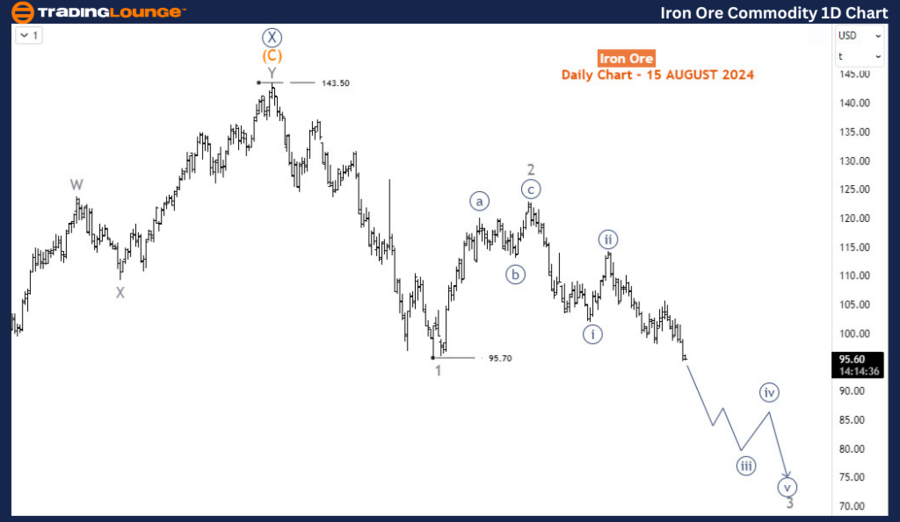
The index reached its peak in May 2021, hitting an all-time high of around $233 per dry metric ton, fueled by strong demand from China and supply constraints among major producers. However, it has since undergone a significant correction, dropping by over 68% to $73 by October 2022. A recovery followed, with the index climbing to $143.5 by December 2023. After a major recovery in April and May 2024, the commodity is now reversing those gains, continuing the sell-off that began in January 2024.
In the long term, the index initiated a bearish corrective phase in May 2021, forming a primary wave W-X-Y (circled). The primary degree waves W and X (circled) concluded at the October 2022 low and January 2024 high, respectively. Wave Y (circled) began at the January 2024 high of 143.5 and is expected to develop into a 3-wave structure consisting of intermediate degree waves (A)-(B)-(C). Currently, the price is in wave 3 of (A), which could extend down to 45, indicating a bearish long-term outlook for the index based on Elliott Wave theory.
H4 chart analysis
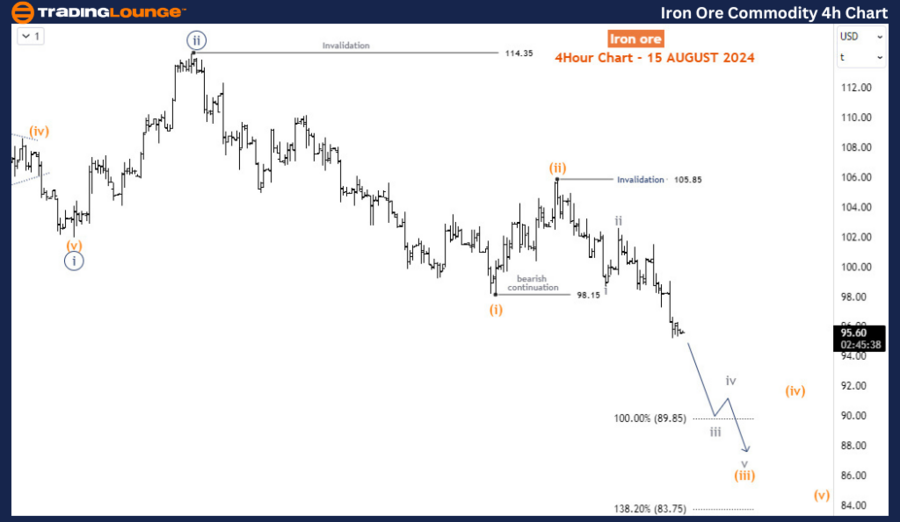
On the H4 chart, wave 3 began at 122.9 and is currently unfolding its 3rd sub-wave, wave iii (circled) of 3. A closer examination shows that the price is in wave (iii) of iii (circled) of 3. In the near term, wave (iii) could reach 85 before a corrective bounce for wave (iv) and then resume its downward trend.
Conclusion
The SGX TSI Iron Ore Index is undergoing a significant bearish correction after peaking in May 2021. The long-term outlook suggests further downside potential, with the index likely to continue its decline as part of a broader corrective wave structure. Traders should be cautious of potential short-term bounces but remain aware of the overall bearish trend that may persist.
Technical analyst: Sanmi Adeagbo.
SGX TSI Iron Ore Index Elliott Wave analysis [Video]
Author

Peter Mathers
TradingLounge
Peter Mathers started actively trading in 1982. He began his career at Hoei and Shoin, a Japanese futures trading company.


