|

Invesco Commodity Index Fund ($DBC) Elliott Wave structure favors more downside

In this technical blog we are going to take a look at the Elliott Wave path in Invesco Commodity Index Fund ($DBC) and explain why the ETF should see more downside in a ZigZag ABC correction towards a Blue Box area.

The fund pursues its investment objective by investing in a portfolio of exchange-traded futures on Light Sweet Crude Oil (WTI), Heating Oil, RBOB Gasoline, Natural Gas, Brent Crude, Gold, Silver, Aluminum, Zinc, Copper Grade A, Corn, Wheat, Soybeans, and Sugar. The index is composed of notional amounts of each of these commodities.

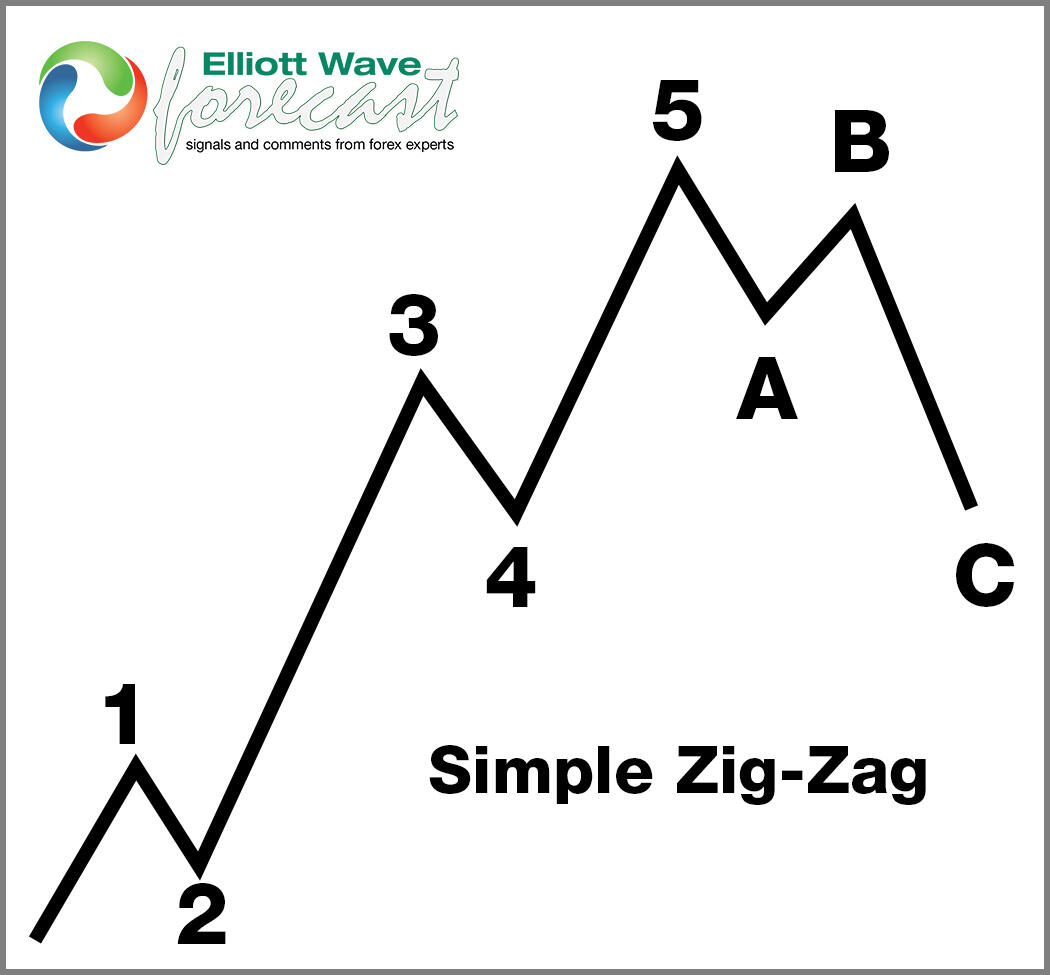
Five wave impulse structure + ABC correction

Chart

$DBC weekly Elliott Wave view – Sep 16, 2024:

DBC

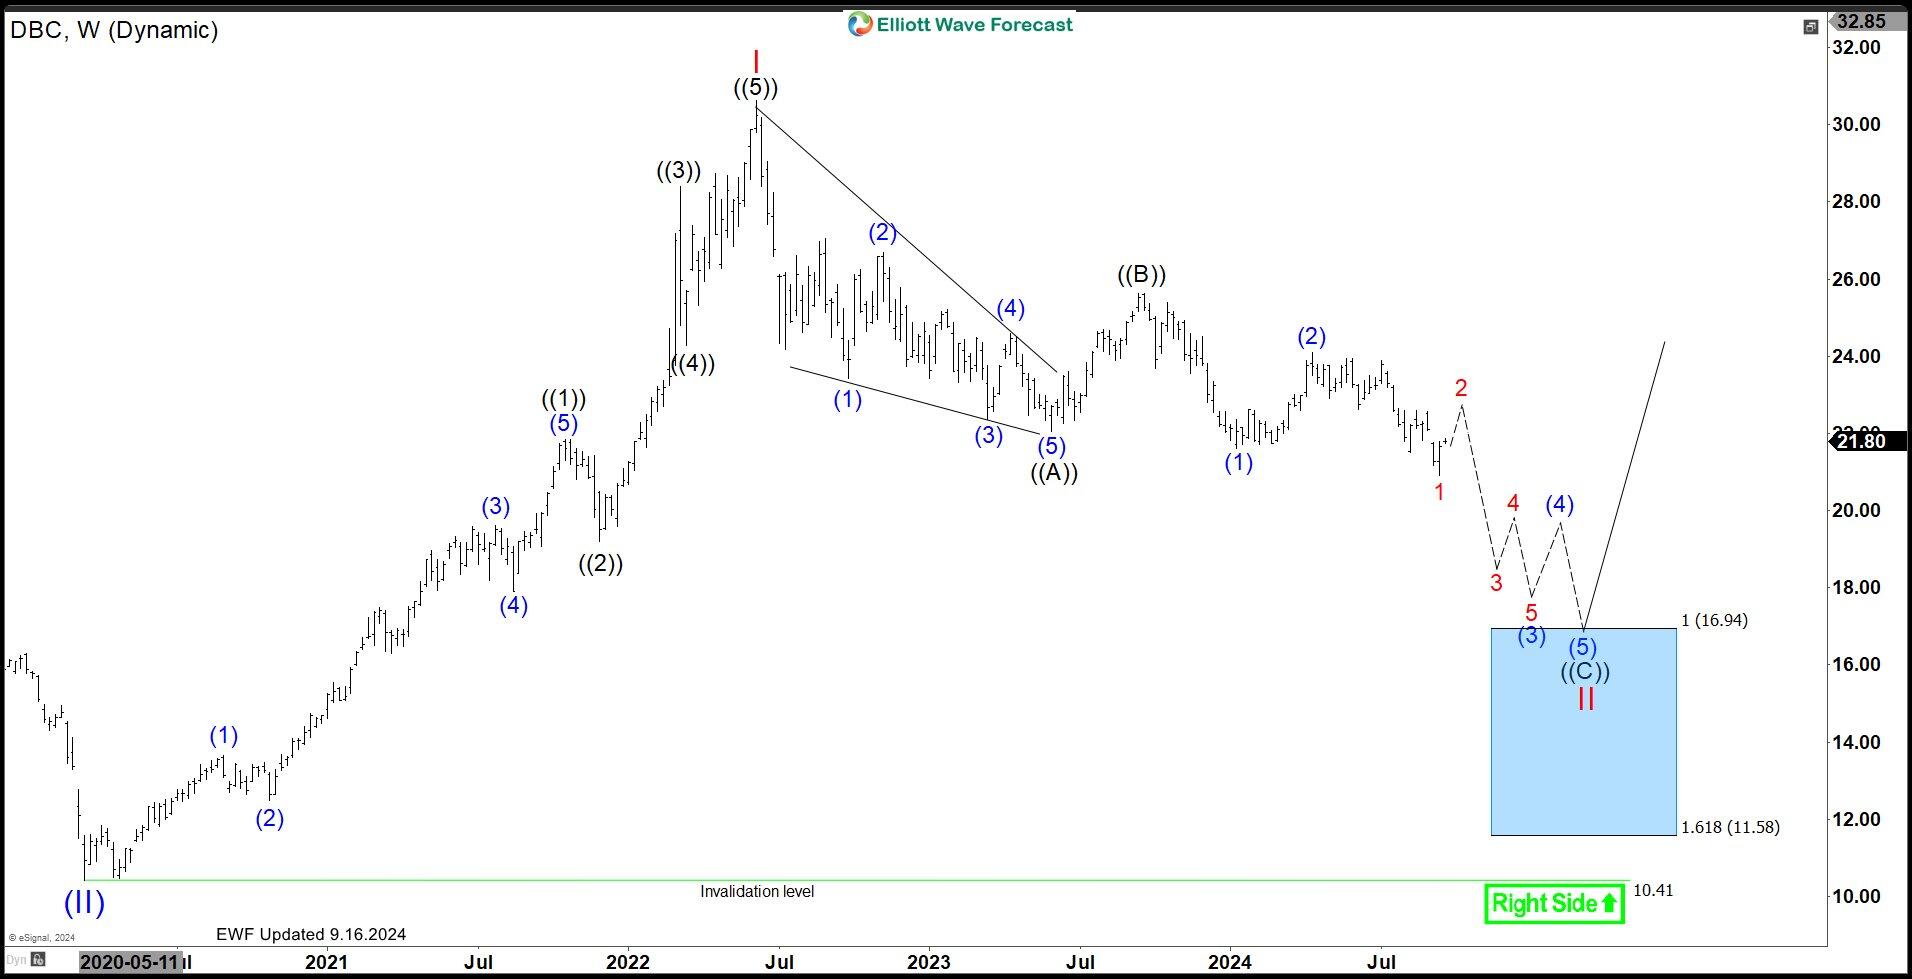
The weekly chart above clearly illustrates the cycle that started from the March 2020 low, unfolding as a 5-wave impulse. This structure suggests the beginning of a bullish trend. However, after the rally peaked in June 2022, the market began to correct in a Zig-Zag pattern.

Initially, the first leg down unfolded in a 5-wave structure. Subsequently, a bounce occurred in 3 swings, which corrected the downward movement. Despite this bounce, it failed at wave ((B)), and sellers managed to push the price below wave ((A)), creating a bearish sequence. As a result, sellers are currently in control and any bounces are likely to fail in either 3 or 7 swings.

On the other hand, buyers may wait for the blue box area for the next opportunity to enter the market. In conclusion, the ETF is expected to remain weak and reach $16.94 to $11.58, where a higher reaction might occur.

Author

Elliott Wave Forecast Team

Elliott Wave Forecast Team

ElliottWave-Forecast.com

More from Elliott Wave Forecast Team
Share:

Editor's Picks

EUR/USD remains depressed below mid-1.1800s; downside potential seems limited

The EUR/USD pair attracts some sellers for the second consecutive day on Tuesday and hovers below mid-1.1800s amid a relatively quiet trading action during the Asian session. The broader fundamental backdrop, however, warrants some caution for bearish traders before positioning for deeper losses.

GBP/USD trades with negative bias, eyes 1.3600 ahead of UK jobs data

The GBP/USD pair trades with a negative bias for the second straight day, though it lacks bearish conviction and holds above the 1.3600 mark through the Asian session on Tuesday. Traders now look forward to the release of the UK monthly jobs report, which will influence the British Pound and provide some impetus to the currency pair.

Gold declines as trading volumes remain subdued due to holidays in China

Gold price extends its losses for the second successive session, trading around $4,930 per troy ounce during the Asian hours on Tuesday. Gold price is trading nearly 0.7% lower at the time of writing as trading volumes stayed thin due to market holidays across China, Hong Kong, and other parts of Asia.

Top Crypto Gainers: Stable, MemeCore and Nexo rally test critical resistance levels

Stable, MemeCore, and Nexo are among the leading gainers in the crypto market over the last 24 hours, while Bitcoin remains below $70,000, suggesting renewed interest in altcoins among investors.

The week ahead: Key inflation readings and why the AI trade could be overdone

It is likely to be a quiet start to the week, with US markets closed on Monday for Presidents Day. European markets are higher across the board and gold is clinging to the $5,000 level after the tamer than expected CPI report in the US reduced haven flows to precious metals.

XRP steadies in narrow range as fund inflows, futures interest rise

Ripple is trading in a narrow range between $1.45 (immediate support) and $1.50 (resistance) at the time of writing on Monday. The remittance token extended its recovery last week, peaking at $1.67 on Sunday from the weekly open at $1.43.