|

Intraday Elliott Wave view on Dow Futures (YM) favors the bullish side [Video]

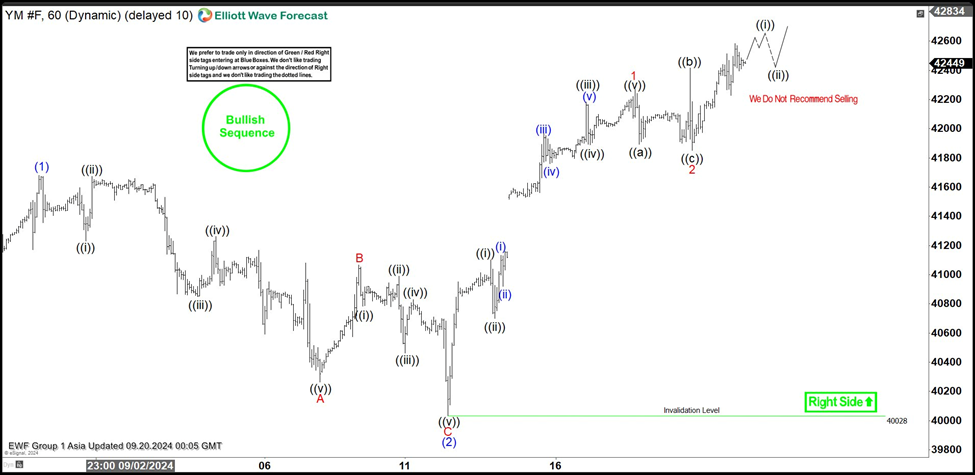
Short term Elliott Wave view on Dow Futures (YM) suggests that cycle from 8.8.2024 low is in progress as an impulse. Up from 8.8.2024 low, wave (1) ended at 41682 and wave (2) pullback ended at 40028 as the 1 hour chart below shows. Internal subdivision of wave (2) unfolded as a zigzag Elliott Wave structure. Down from wave (1), wave A ended at 40264 and rally in wave B ended at 41065. The Index then extended lower in wave C towards 40028 which completed wave (2) in higher degree.

Index has turned higher in wave (3). Internal subdivision of wave (3) is unfolding as a 5 waves impulse. Up from wave (2), wave ((i)) ended at 41100 and wave ((ii)) pullback ended at 40701. Wave ((iii)) higher ended at 42184, and wave ((iv)) pullback ended at 41890. Final leg wave ((v)) ended at 42270 which completed wave 1 in higher degree. Pullback in wave 2 unfolded as an expanded flat where wave ((a)) ended at 41893, wave ((b)) ended at 42416 and wave ((c)) ended at 41850. Index has resumed higher in wave 3 of (3). Near term, as far as pivot at 40028 low stays intact, expect dips to find support in 3, 7, or 11 swing for further upside.

Dow Futures (YM) 60 minutes Elliott Wave chart

DOW

Dow Futures (YM) Elliott Wave [Video]

Author

Elliott Wave Forecast Team

Elliott Wave Forecast Team

ElliottWave-Forecast.com

More from Elliott Wave Forecast Team
Share:

Editor's Picks

EUR/USD seems fragile below 1.1700 as Middle East war boosts energy prices

The EUR/USD pair trades flat at around 1.1680 during the Asian trading session on Tuesday, but broadly seems vulnerable, being close to its five-week low. The major currency pair is under pressure as surging oil prices due to the United States-Israel war with Iran have increased the risks of higher inflation for the Old Continent.

GBP/USD hovers around 1.3400 with bearish pressure intact

GBP/USD edges higher after three days of losses, trading around 1.3400 during the Asian hours on Tuesday. The technical analysis of the daily chart indicates an ongoing bearish bias, as the pair trades within a descending channel pattern.

Gold stays bullish as Iran war continues to spur safe-haven flows

Gold is finding renewed bids in Asian trades on Tuesday, making another attempt to regain the $5,400 level amid persistent demand for safe-haven assets as the Iran war extends. A softer risk tone remains in play as US President Donald Trump continues to threaten deeper escalation to the ongoing war with Iran, warning that a “big wave” is yet to come.

Top Crypto Gainers: Near Protocol, Virtuals Protocol, and Morpho lead market recovery

Near Protocol, Virtuals Protocol, and Morpho are leading the market recovery with double-digit gains over the last 24 hours. Technically, NEAR extends the breakout of the falling channel pattern, VIRTUAL holds above the 50-day EMA, while MORPHO tests a crucial resistance. 

The market is not panicking it is repricing the probability distribution of Oil and time

At the end of the day, markets do not trade morality or geopolitics. They trade transmission channels. And the only channel that truly matters in this maelstrom runs through the price of energy and the time value of money.

Grass 20% bullish breakout defies broader market weakness

Grass (GRASS) is edging up above $0.30 at the time of writing on Monday. The token’s notable 20% intraday surge stands out amid heightened volatility in the broader crypto market.